Discovery Quickstart
Discovery uses AI to extract topics of conversation, providing insights into your customer-agent interactions. Discovery can help you find opportunities to improve your business and get ahead of customer trends.
This tutorial explains how to create and run new discoveries on selected services. The discovery data is then available for analysis.
Prerequisites
Discovery requires interaction transcripts. For chat services, no prerequisites are required. For voice services, transcripts must be enabled with the following configurations:
- Call recordings are enabled for the service in either of the following ways:
- By enabling the global Quality Management setting Call Recording to record calls on all services.
- By enabling the service-specific property Record Calls on each service.
- Either historical or real-time transcription is enabled for the service:
Procedure
Follow these steps to configure a Discovery and run it across your services:
Create a New Discovery
Navigate to the Discovery section and use the multi-step wizard to define the scope and prompts for your new discovery.
Access all our self-help videos in the library here: https://brightpattern.screencasthost.com/
1. Create the Scope and Generate Initial Tags
The first step in creating a new discovery is to generate an initial list of tags from a sample of your interactions. This list provides a baseline that you will use in the next step to refine the AI's behavior and improve the accuracy of future tag generation.
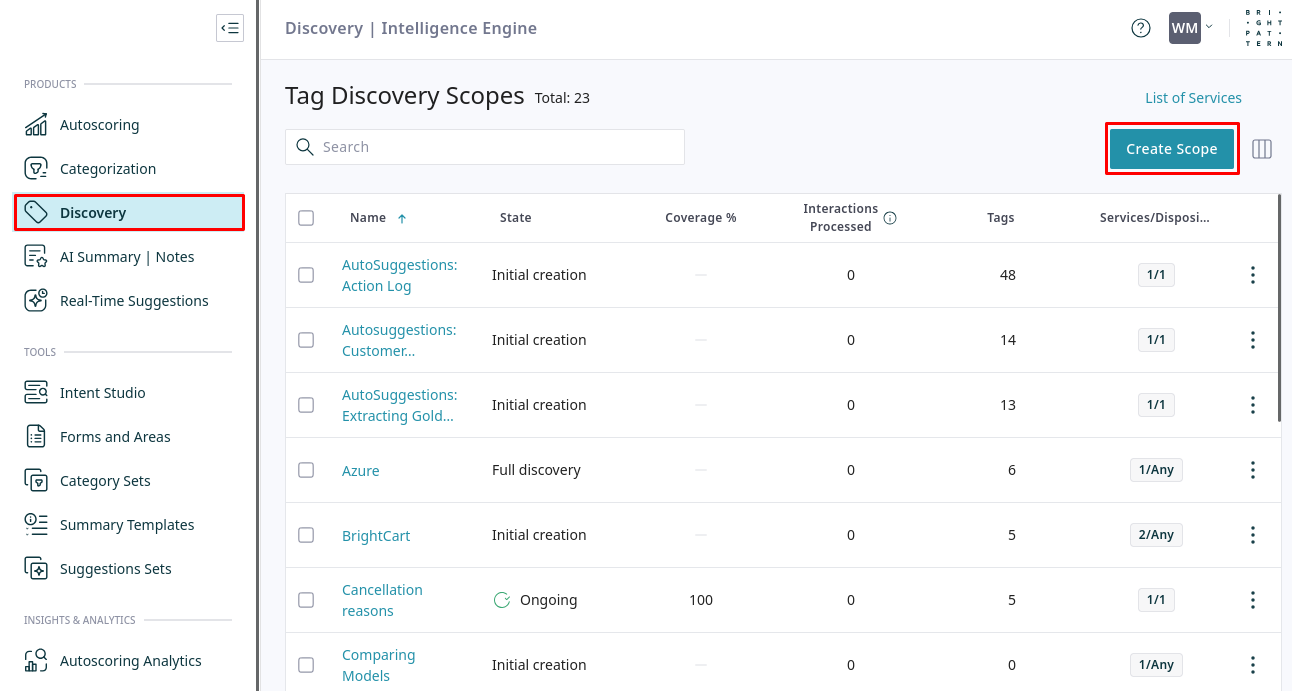
- Navigate to Discovery from the main menu and click Create Scope.
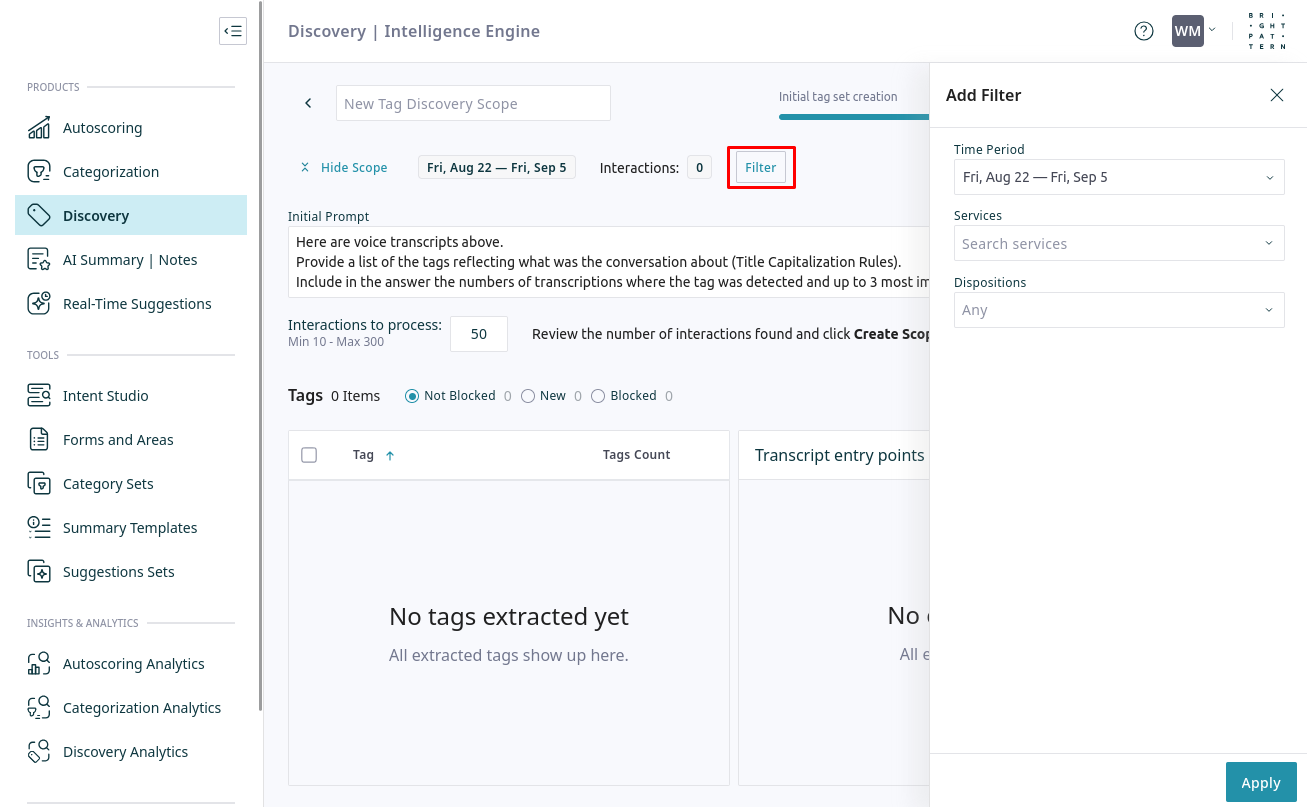
- Click Filter to open the filter settings. Select a Time Period, Services, and Dispositions to determine the data set for analysis, then click Apply. Note that the services you select will be assigned to this discovery.
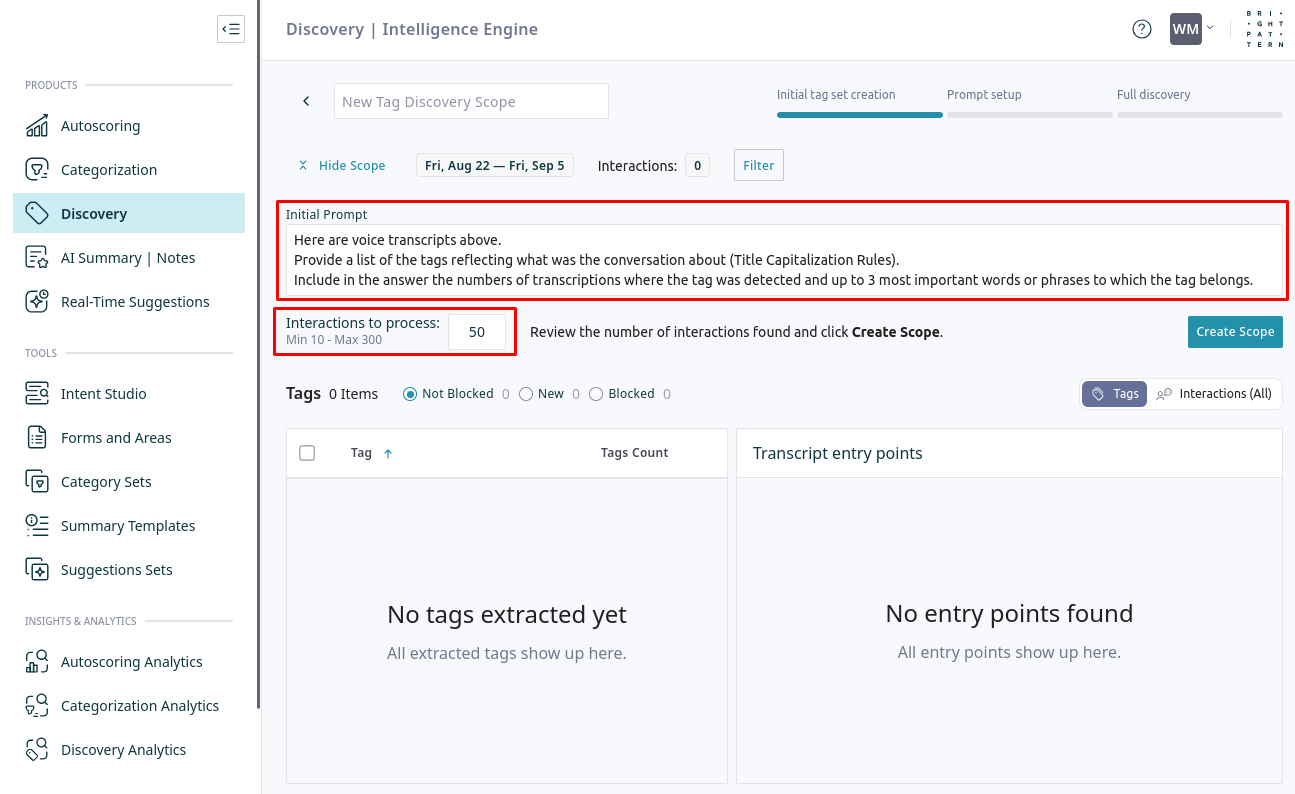
- Write an Initial Prompt that instructs the AI what to extract from the conversations, select the number of Interactions to process for the initial run, and click Create Scope to save the settings. Once the scope is saved, click Run to extract tags from the sample of interactions.
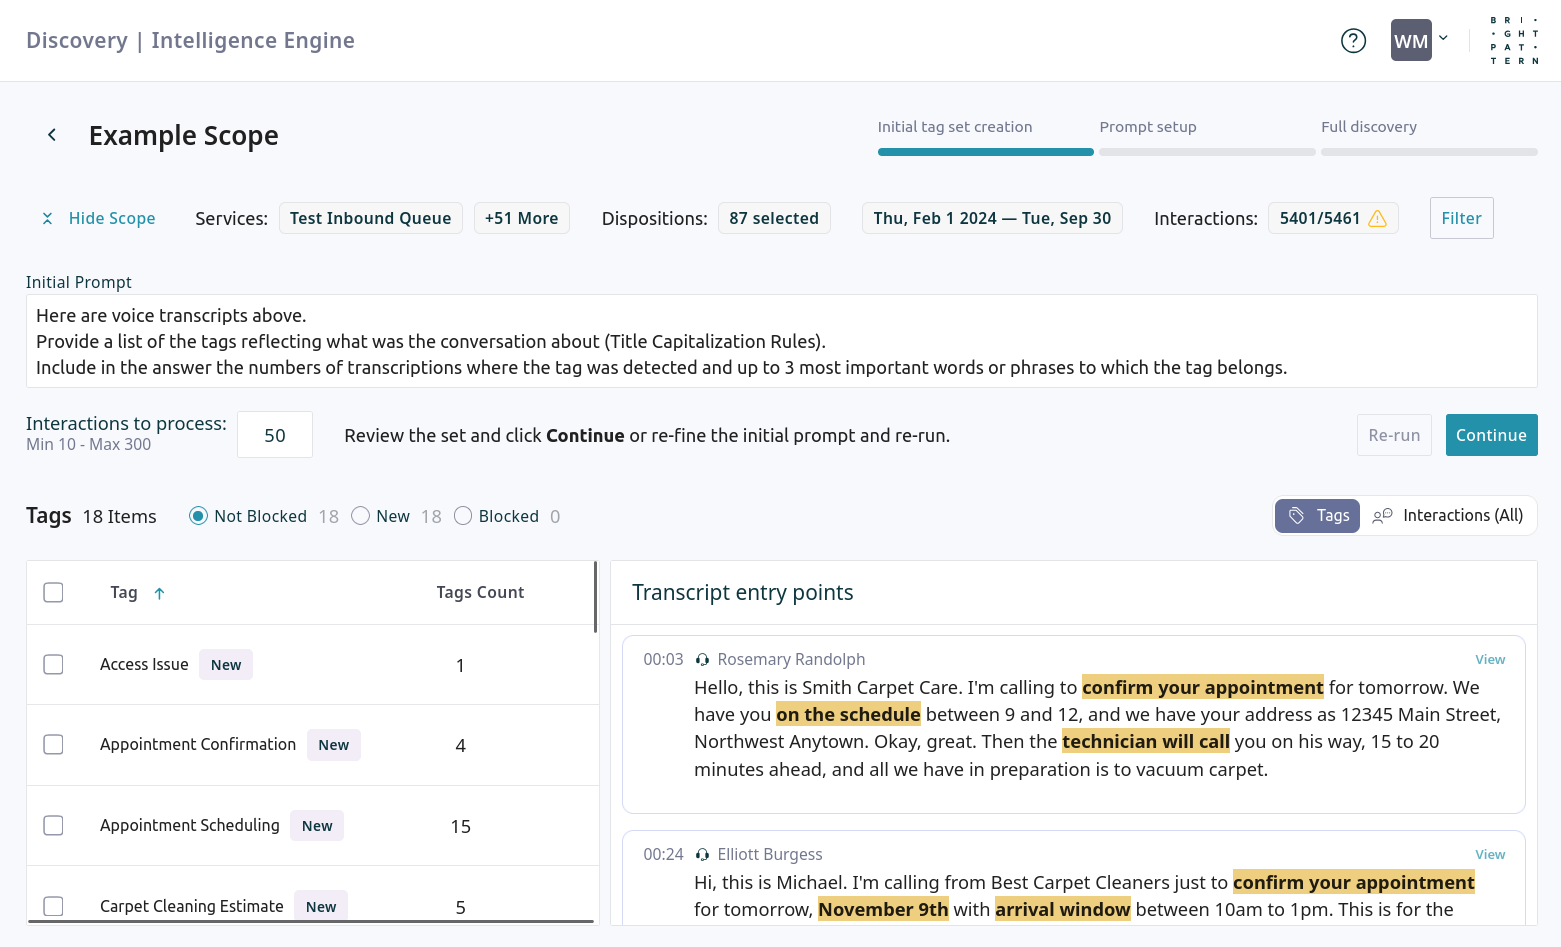
- After the analysis is complete, review the results.
- The left panel displays the tags extracted from the interactions.
- The right panel shows the corresponding transcript entry points for the selected tag.
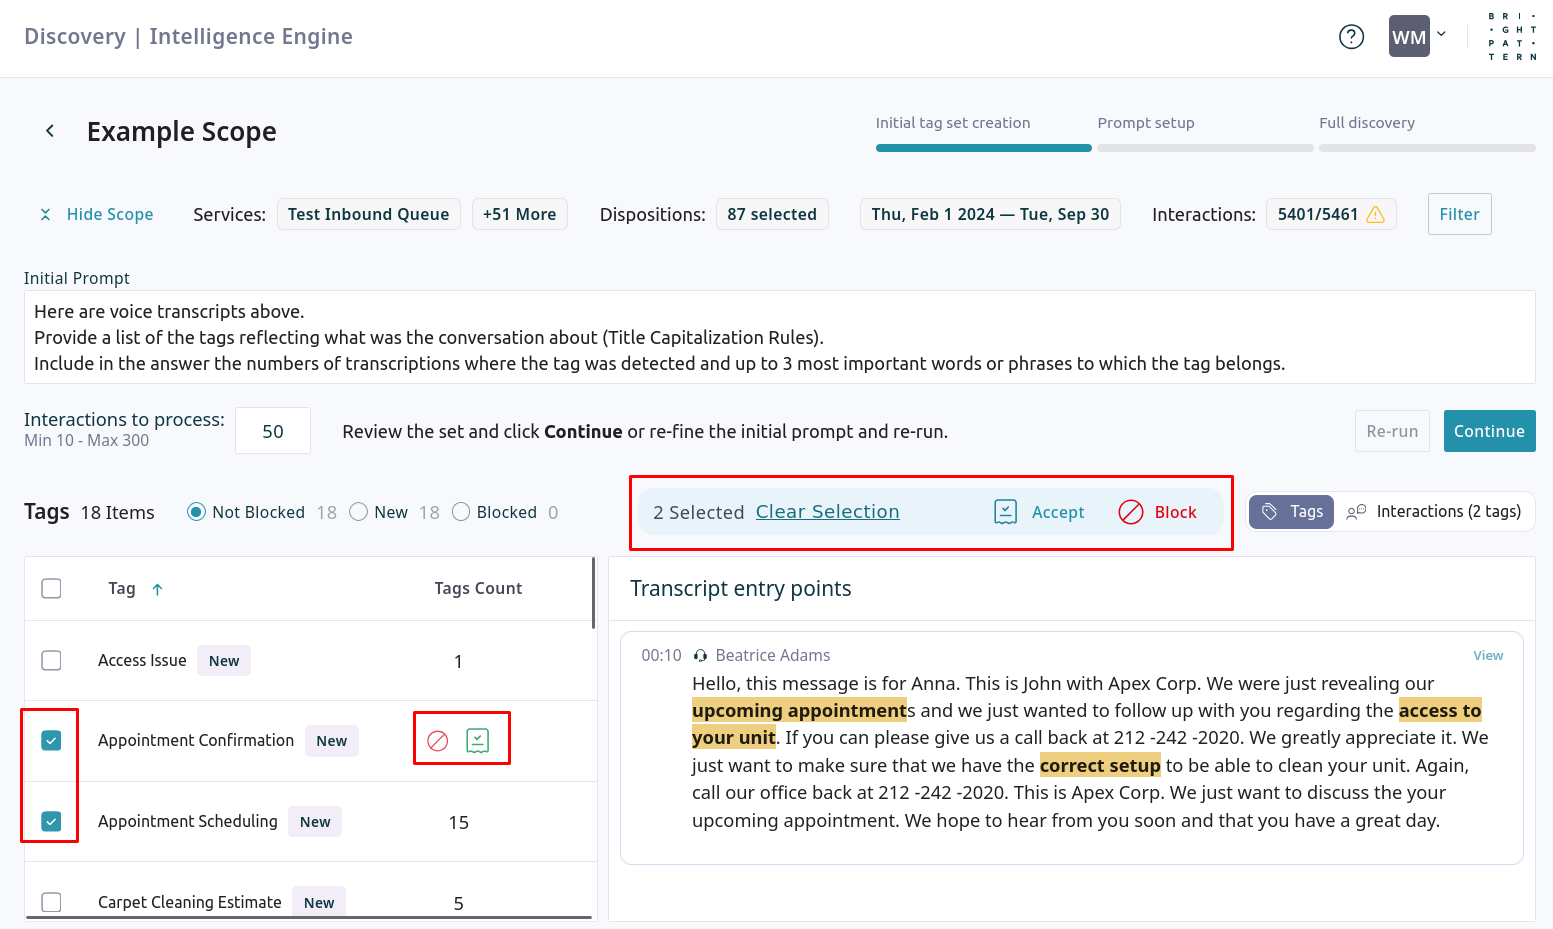
- Accept or block tags to refine the tag list. Blocking irrelevant or duplicate tags helps the AI produce more accurate results in the next step.
- Once you are satisfied with the tag list, click Continue to proceed to the next step.
2. Refine the Prompt
In this step, you can refine the prompt used for ongoing analysis of new interactions. You can include the list of tags you accepted and blocked in the previous step with the All Accepted Tags and Blocked Tags variables. This allows you to instruct the AI to reuse existing tags and avoid creating new ones that you have already blocked.
- The prompt is pre-populated with instructions that use the
All Accepted Tagsvariable. You can edit the prompt and optionally add theBlocked Tagsvariable to further customize the AI's behavior.
- Set the number of Interactions to process and click Run to test the effectiveness of the prompt.
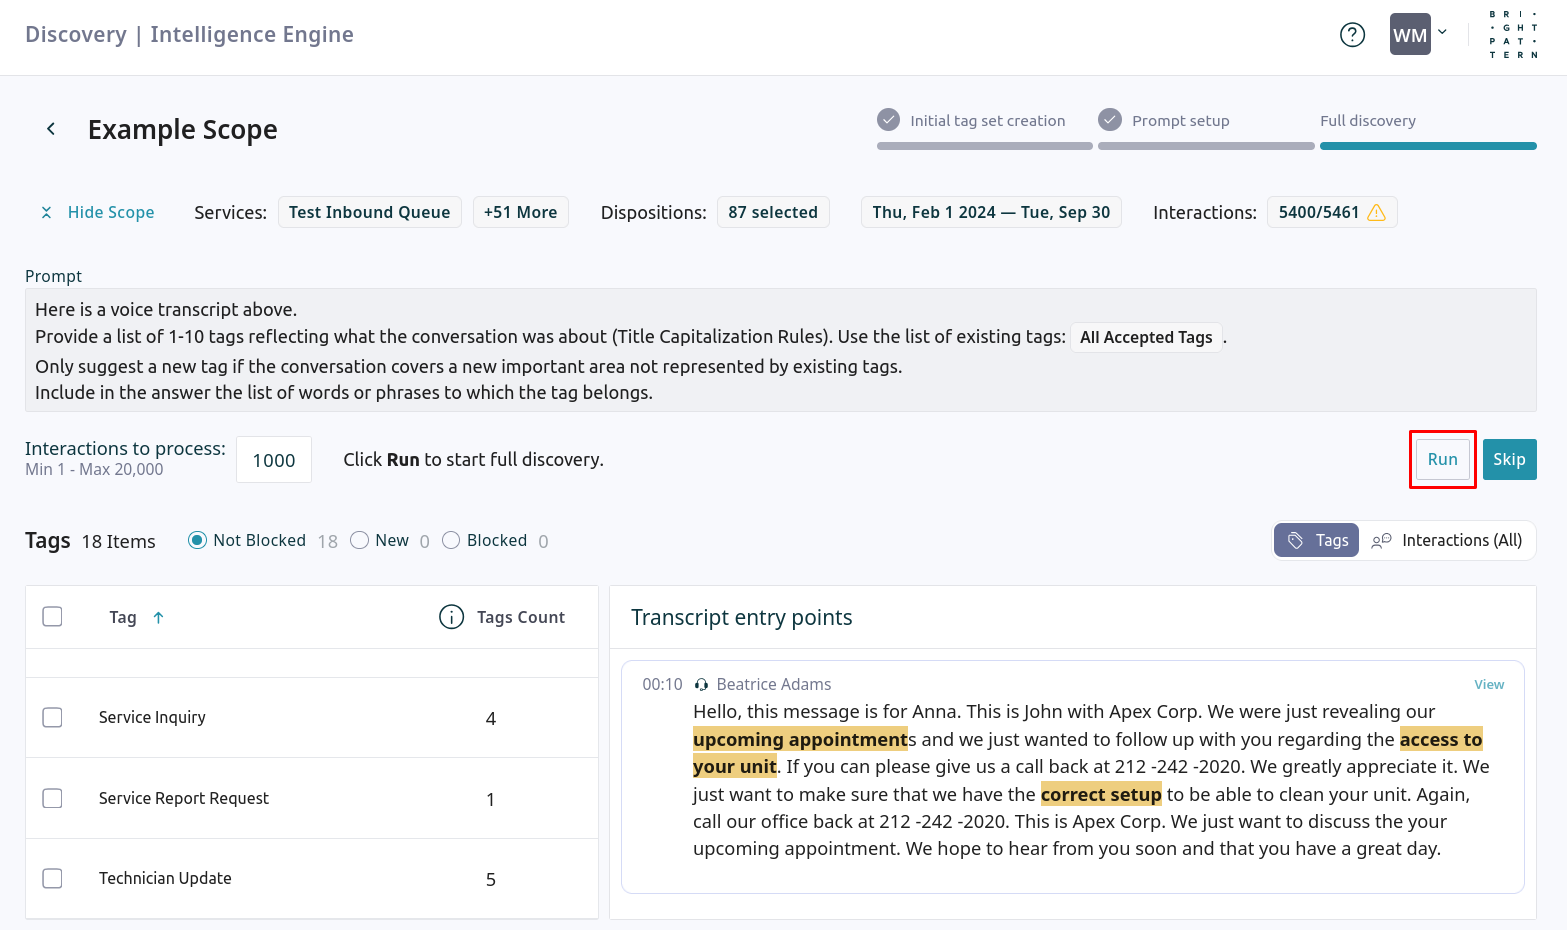
- After the test run completes, review any newly generated tags. Accept or block them as you did in the previous step.
- You may click Re-run to test different versions of the prompt. Click Continue to proceed to full discovery.
3. Run a Full Discovery on Historical Data
This step applies your refined prompt to a large set of historical interactions. The process tags these past conversations, creating a comprehensive data set that you can analyze in a dashboard.
- Set the number of Interactions to process, up to 20,000, and then click Run to begin the analysis. The process runs in the background and may take a significant amount of time to complete, depending on how many interactions you've set to process.
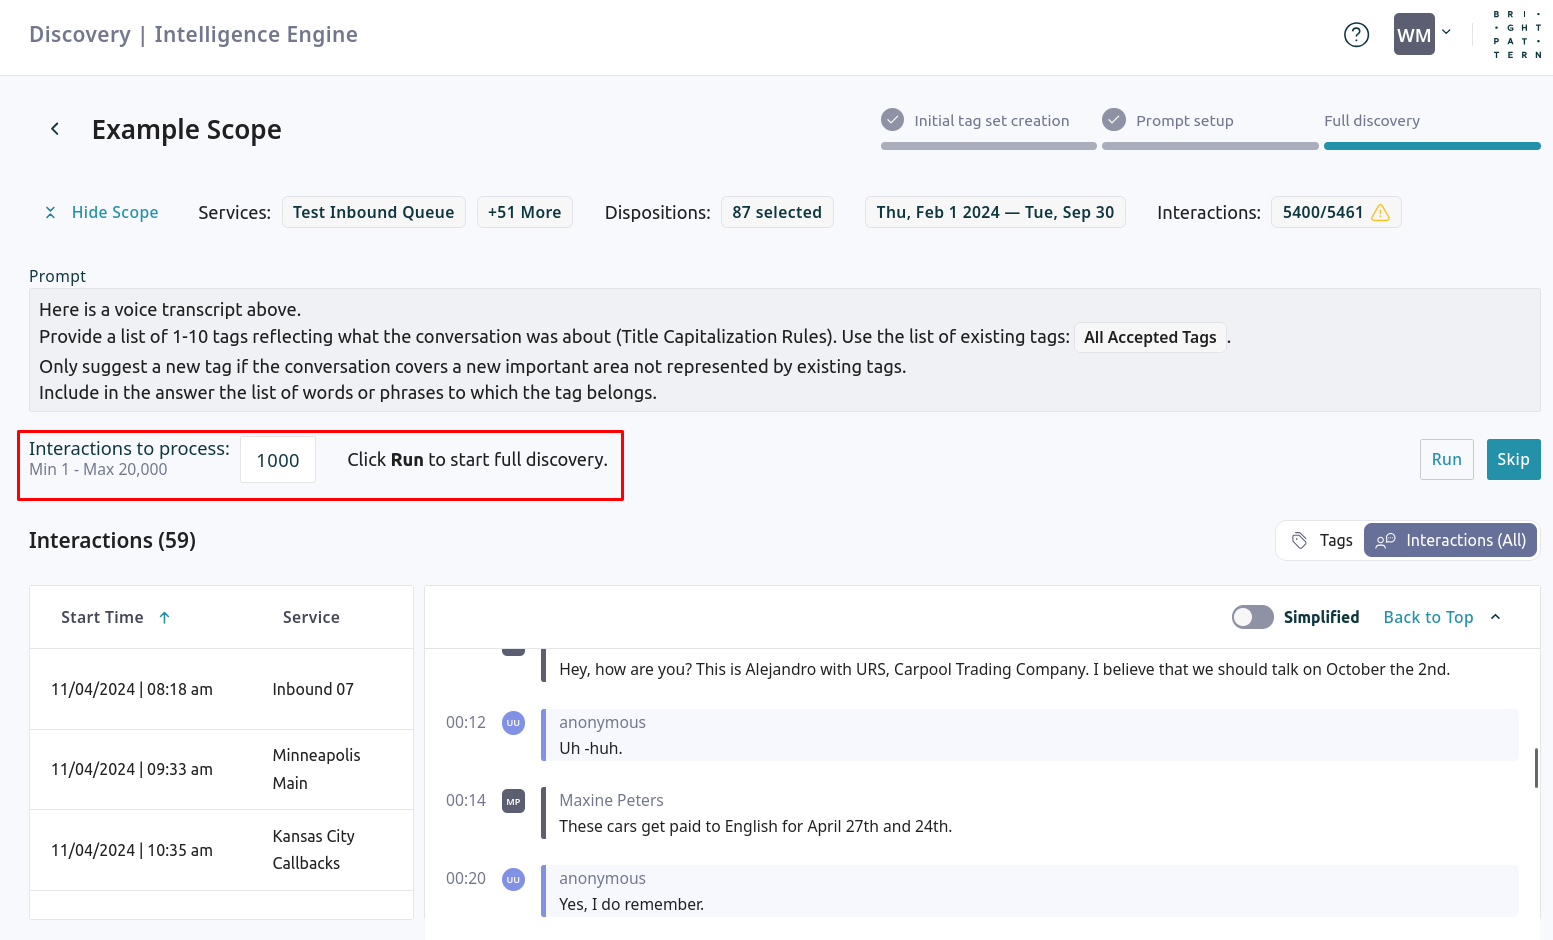
- Once the analysis is finished, review the complete list of generated tags. Accept and block tags as needed to finalize the list.
- After clicking Continue, you will have the option to Set Ongoing Discovery.

Enabling ongoing discovery applies your refined prompt to a percentage of new interactions as they occur. This allows you to automatically tag conversations and monitor trends over time.
4. Enable Ongoing Analysis
- Set the Interactions for analysis, %. This controls costs by determining what percentage of new, incoming interactions will be analyzed. Click Run to activate the ongoing discovery.

- The discovery's status will change to Ongoing on the Tag Discovery Scopes page. You can return to this page at any time to pause the discovery.

Create a New Dashboard to Analyze Tags
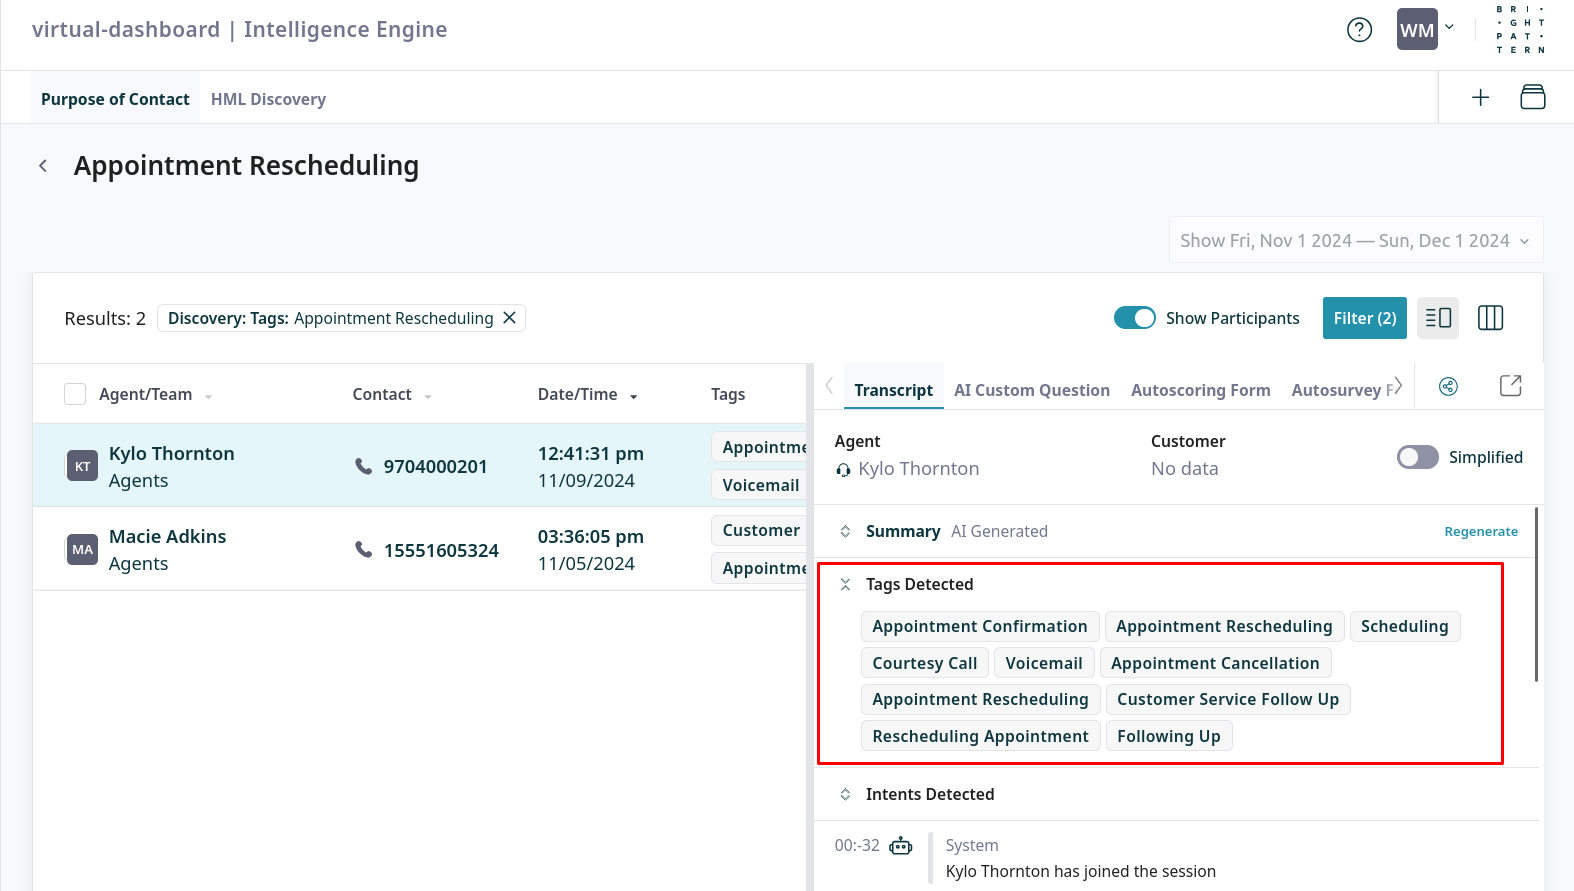
Once your discovery has generated tags, create a dashboard in Discovery Analytics to visualize and explore the data.
Access all our self-help videos in the library here: https://brightpattern.screencasthost.com/
1. Create the dashboard and select a discovery
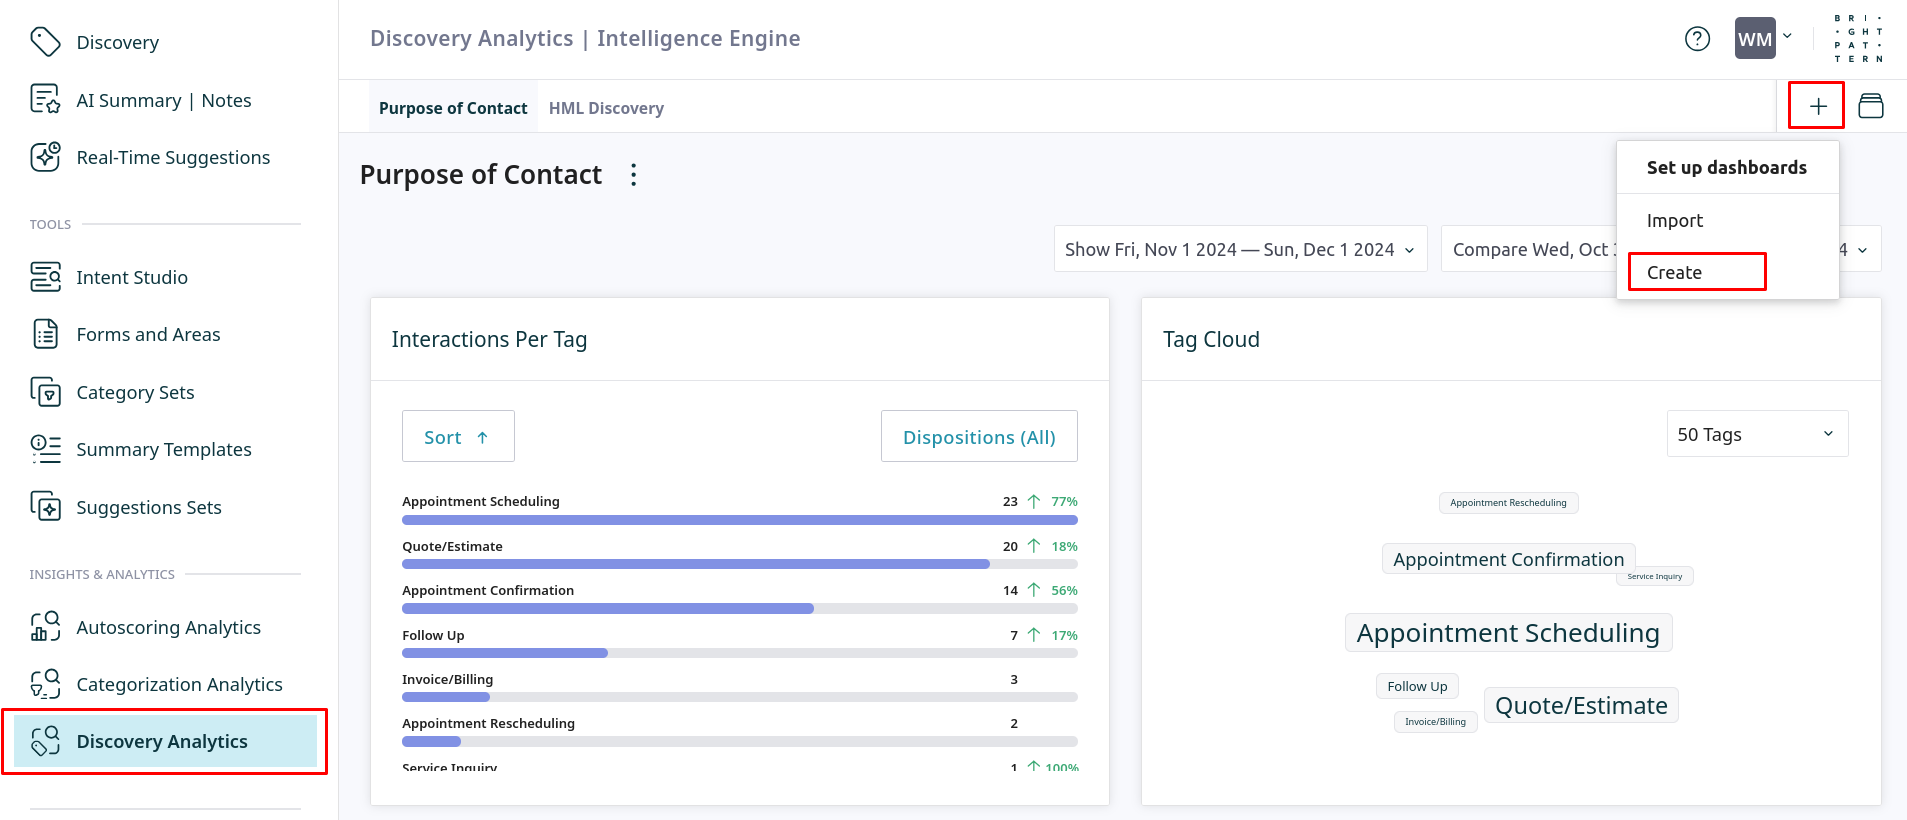
- Navigate to Discovery Analytics, click the + icon and select Create.
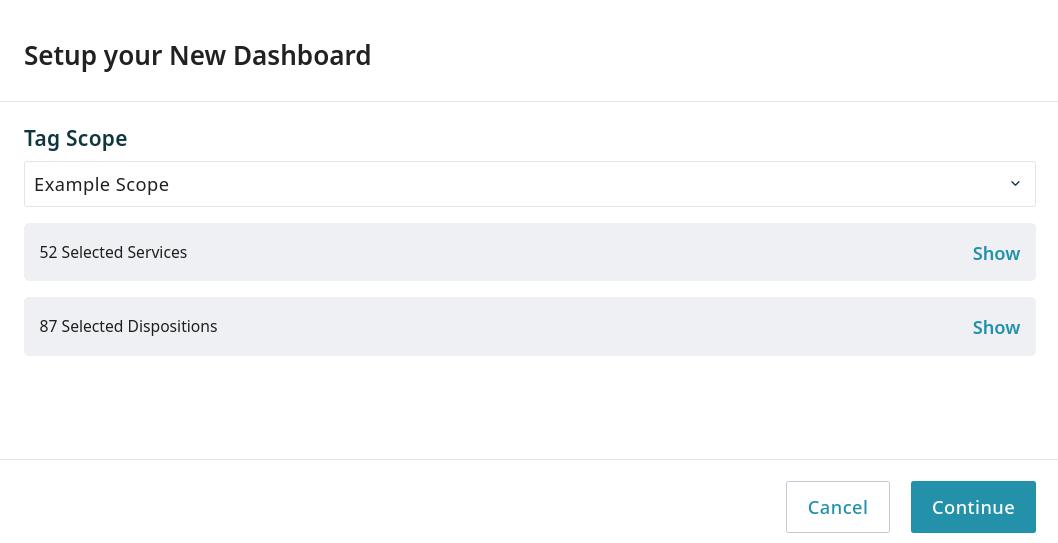
- Select the desired discovery scope from the list and click Continue.
2. Add widgets
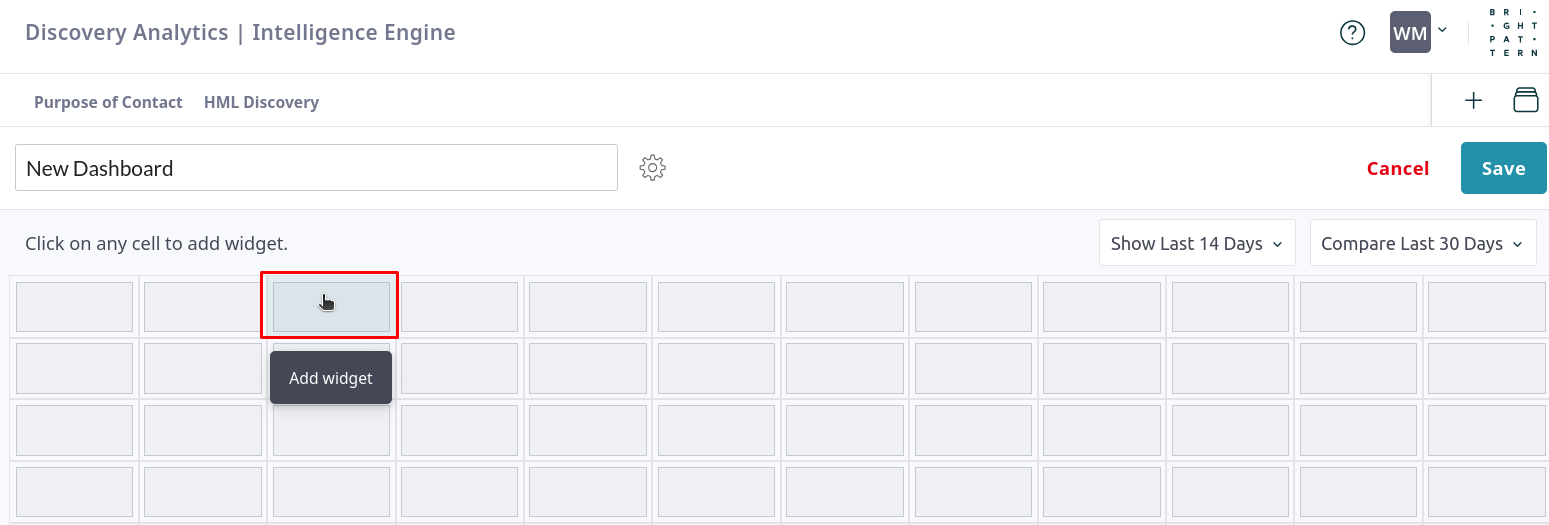
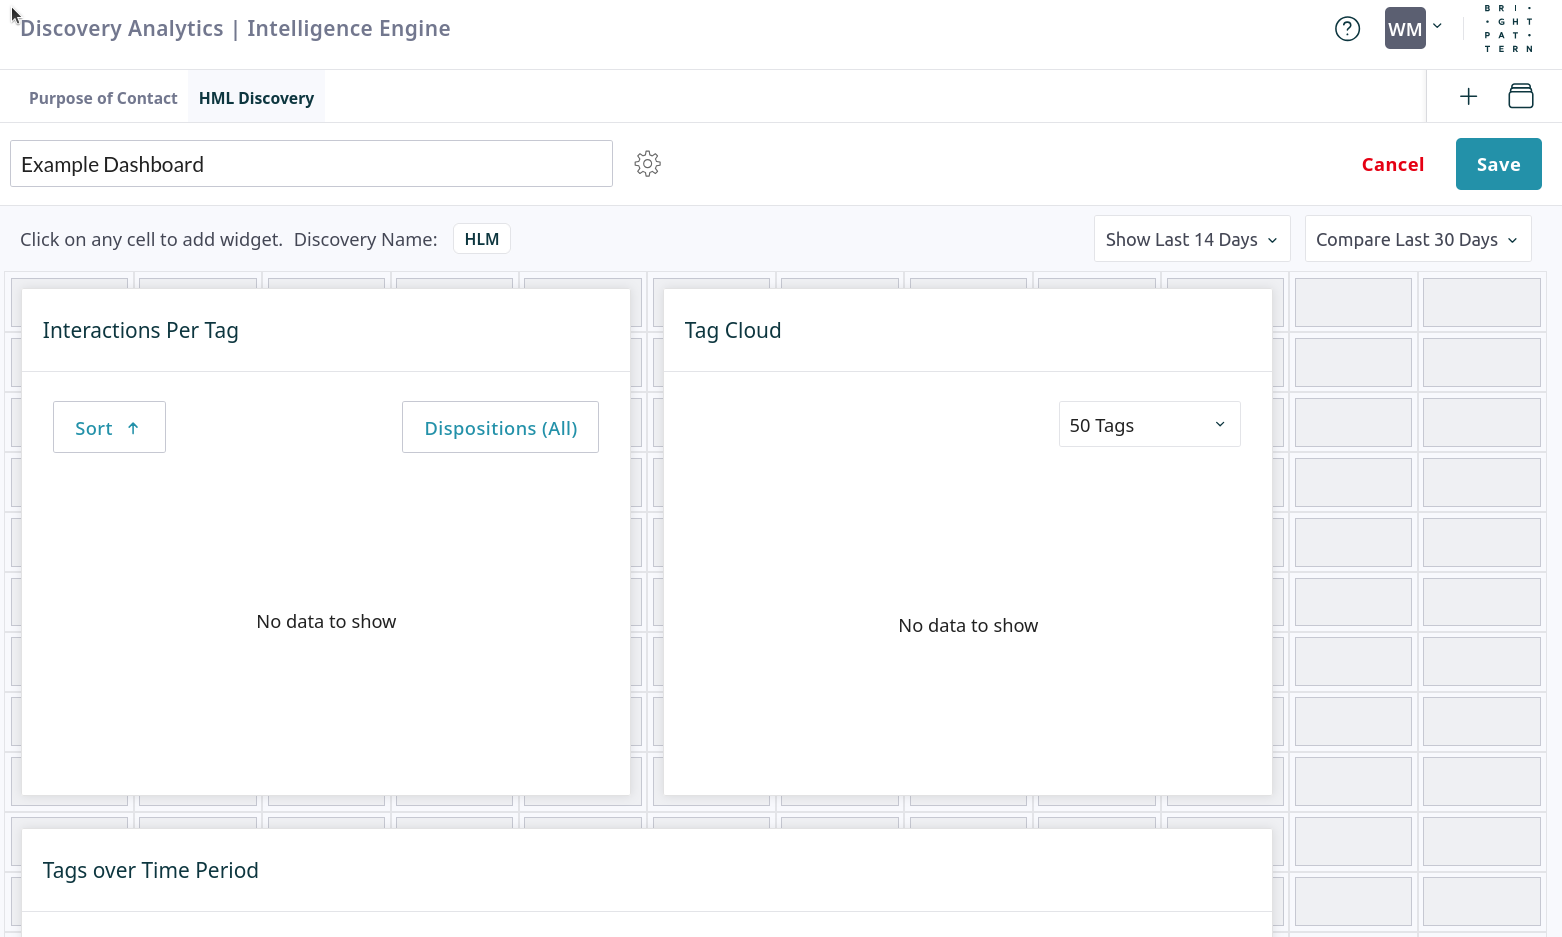
- In the new dashboard, click an empty cell to add a widget.
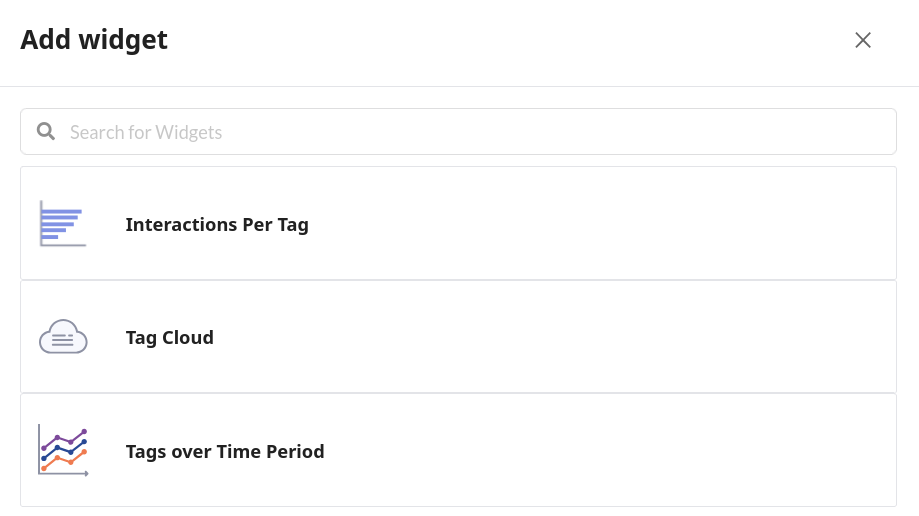
- Select a widget type, such as Interactions per tag, Tag cloud, or Tags over Time Period.
- Resize and rearrange widgets on the dashboard as needed, then click Save.
3. Drill Down to View Interactions
Discovery Analytics dashboards provide high-level insights. You can also drill down from any widget to view the specific interactions for a tag and investigate their context.
- Open the dashboard, and click on a tag in the Tag Cloud widget.
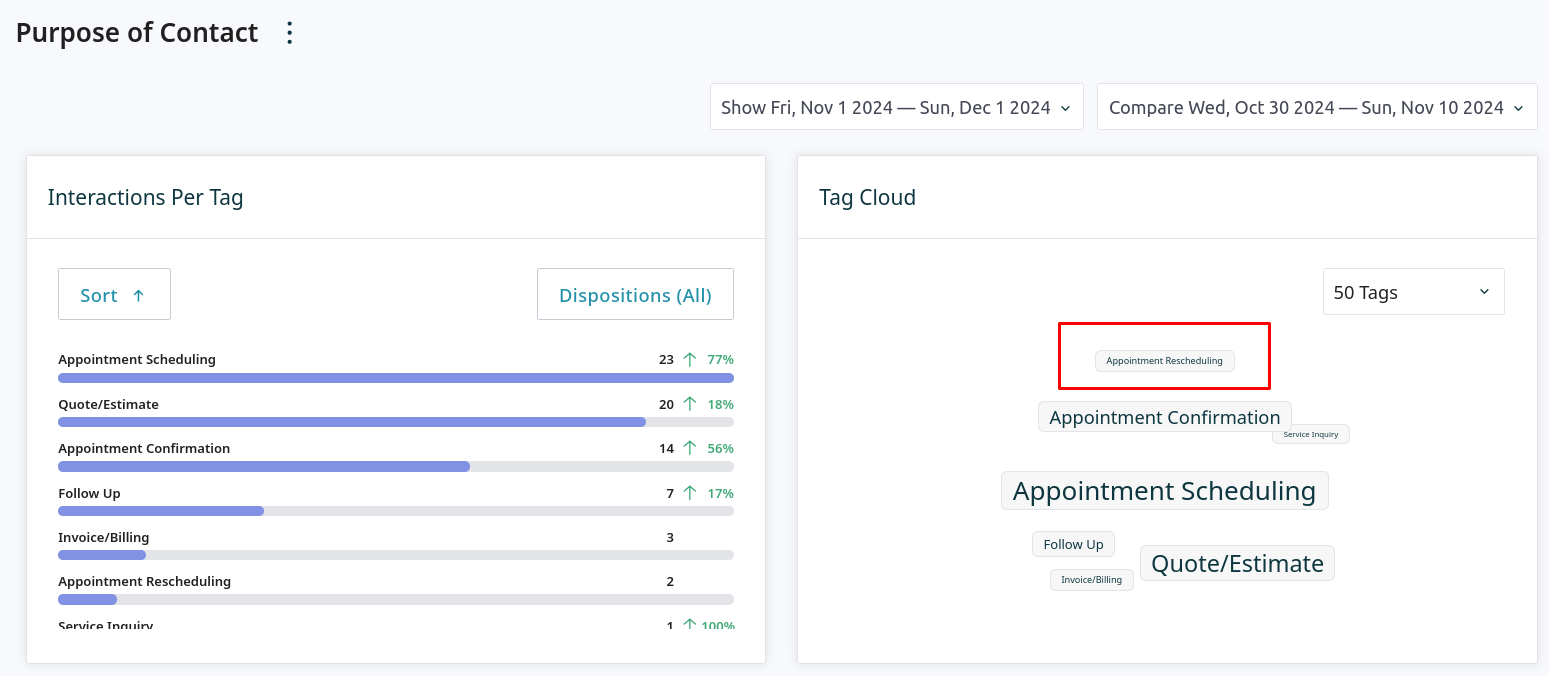
- Select View interactions.
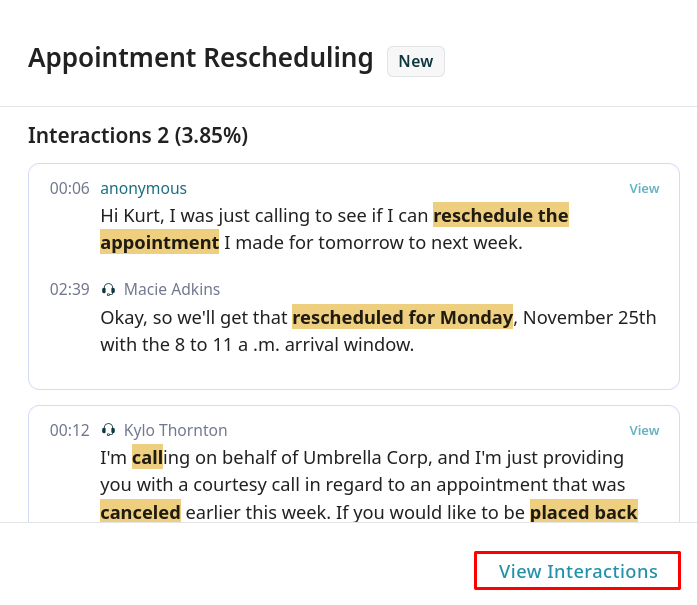
- This opens the Search page, pre-filtered by the selected discovery and tag.
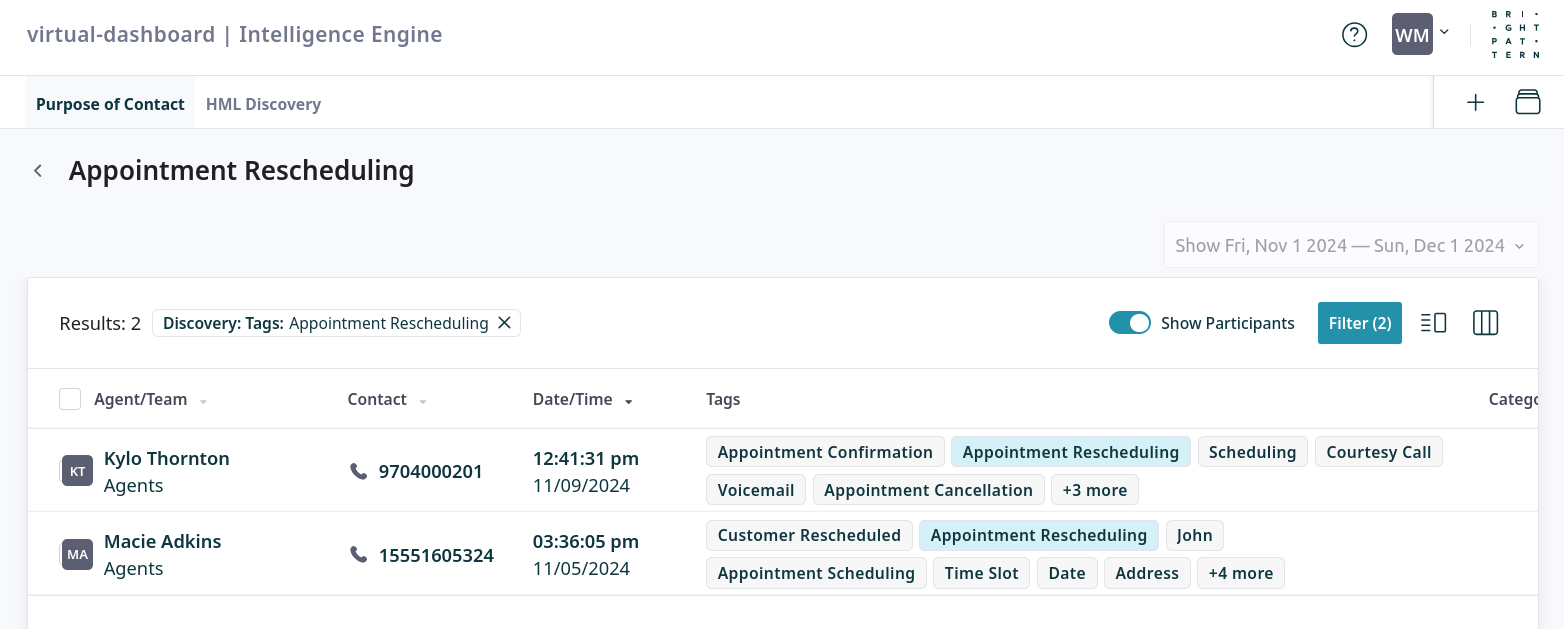
- Select an interaction to view its details, including the full transcript. In the interaction details, click a tag to jump directly to the point in the conversation where it was mentioned.
