From Bright Pattern Documentation
| Line 11: | Line 11: | ||
* The actual real-time value of this metric will be highlighted with a selected color in the metrics view. When the actual value drops below the threshold, the alert will be cleared, i.e., the metric value will again be displayed with the regular color. | * The actual real-time value of this metric will be highlighted with a selected color in the metrics view. When the actual value drops below the threshold, the alert will be cleared, i.e., the metric value will again be displayed with the regular color. | ||
| + | |||
| + | For more information, see ''Tutorials for Supervisors'', section [[Tutorials-for-supervisors/CustomizingReal-TimeMetricAlerts|Customizing Real-Time Metric Alerts]]. | ||
| Line 16: | Line 18: | ||
| − | |||
| − | |||
| − | |||
| − | |||
| − | |||
| − | |||
| − | |||
| − | |||
| − | |||
| − | |||
| − | |||
| − | |||
| − | |||
| − | |||
| − | |||
| − | |||
| − | |||
| − | |||
| − | |||
| − | |||
| − | |||
| − | |||
| − | |||
| − | |||
| − | |||
| − | |||
| − | |||
| − | |||
| − | |||
| − | |||
| − | |||
| − | |||
| − | |||
| − | |||
| − | |||
| − | |||
Revision as of 22:33, 15 January 2019
Real-Time Metric Alerts
You can set thresholds for some of the service, campaign, and agent metrics and be visually alerted whenever the current values of the corresponding metrics reach those thresholds.
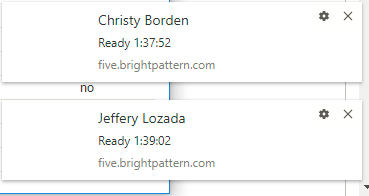
Visual alerts are provided in two forms: a pop-up window and a color change in the metrics view. You can configure a different alert color for each metric and choose whether the text or the background of the corresponding cell will be highlighted with this color. Whenever a configured threshold is reached for a specific metric:
- A pop-up window will be displayed with the metric name and its actual current value.
- The actual real-time value of this metric will be highlighted with a selected color in the metrics view. When the actual value drops below the threshold, the alert will be cleared, i.e., the metric value will again be displayed with the regular color.
For more information, see Tutorials for Supervisors, section Customizing Real-Time Metric Alerts.


