| Line 1: | Line 1: | ||
<translate>= Service Metrics View= | <translate>= Service Metrics View= | ||
Service metrics are located in the Supervision [[File:Supervision-Icon-AD-50.png|26px]] section of Agent Desktop and displayed in the middle of the ''Context Information Area''. This view displays metrics for either all services assigned to the selected team or all services assigned to all teams. You may toggle between specific team views and the ''All Teams'' view. | Service metrics are located in the Supervision [[File:Supervision-Icon-AD-50.png|26px]] section of Agent Desktop and displayed in the middle of the ''Context Information Area''. This view displays metrics for either all services assigned to the selected team or all services assigned to all teams. You may toggle between specific team views and the ''All Teams'' view. | ||
| − | |||
You can have services sorted automatically by the value of any currently displayed metric. To manually sort the metrics, click on the desired metric name; the default sort view is high to low. By default, services are sorted alphabetically. | You can have services sorted automatically by the value of any currently displayed metric. To manually sort the metrics, click on the desired metric name; the default sort view is high to low. By default, services are sorted alphabetically. | ||
| + | The bottom row of the service metrics view displays the cumulative values for all currently displayed services. In the ''Name'' column, the bottom row shows the total number of currently displayed services. For detailed descriptions of the available service metrics, see section [[supervisor-guide/ListofServiceMetrics|List of Service Metrics]]. For definitions of all real-time metrics, see [[reporting-reference-guide/AllMetrics|List of All Real-Time Metrics]] in the ''Reporting Reference Guide''. | ||
| − | + | To learn how to customize service metrics, see ''Tutorials for Supervisors'', section [[Tutorials-for-supervisors/CustomizingMetrics|Customizing Metrics]]. | |
| Line 22: | Line 22: | ||
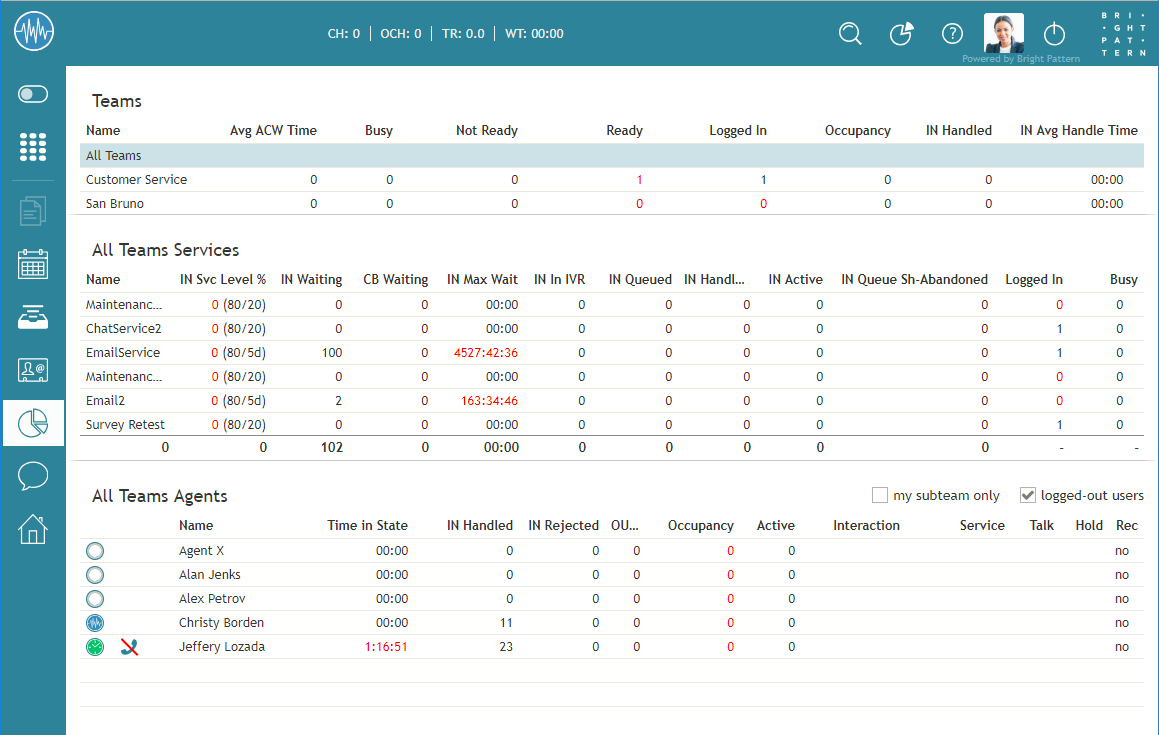
[[File:RTM-All-Teams-Metrics-50.PNG|800px|thumbnail|center|Supervisors may view service metrics for all teams they have permission to supervise]] | [[File:RTM-All-Teams-Metrics-50.PNG|800px|thumbnail|center|Supervisors may view service metrics for all teams they have permission to supervise]] | ||
| − | |||
| − | |||
| − | |||
| − | |||
| − | |||
| − | |||
| − | |||
| − | |||
| − | |||
| − | |||
| − | |||
| − | |||
| − | |||
| − | |||
| − | |||
| − | |||
| − | |||
| − | |||
| − | |||
| − | |||
| − | |||
Revision as of 22:20, 15 January 2019
Service Metrics View
Service metrics are located in the Supervision ![]() section of Agent Desktop and displayed in the middle of the Context Information Area. This view displays metrics for either all services assigned to the selected team or all services assigned to all teams. You may toggle between specific team views and the All Teams view.
section of Agent Desktop and displayed in the middle of the Context Information Area. This view displays metrics for either all services assigned to the selected team or all services assigned to all teams. You may toggle between specific team views and the All Teams view.
You can have services sorted automatically by the value of any currently displayed metric. To manually sort the metrics, click on the desired metric name; the default sort view is high to low. By default, services are sorted alphabetically.
The bottom row of the service metrics view displays the cumulative values for all currently displayed services. In the Name column, the bottom row shows the total number of currently displayed services. For detailed descriptions of the available service metrics, see section List of Service Metrics. For definitions of all real-time metrics, see List of All Real-Time Metrics in the Reporting Reference Guide.
To learn how to customize service metrics, see Tutorials for Supervisors, section Customizing Metrics.
Service Metrics for One Team
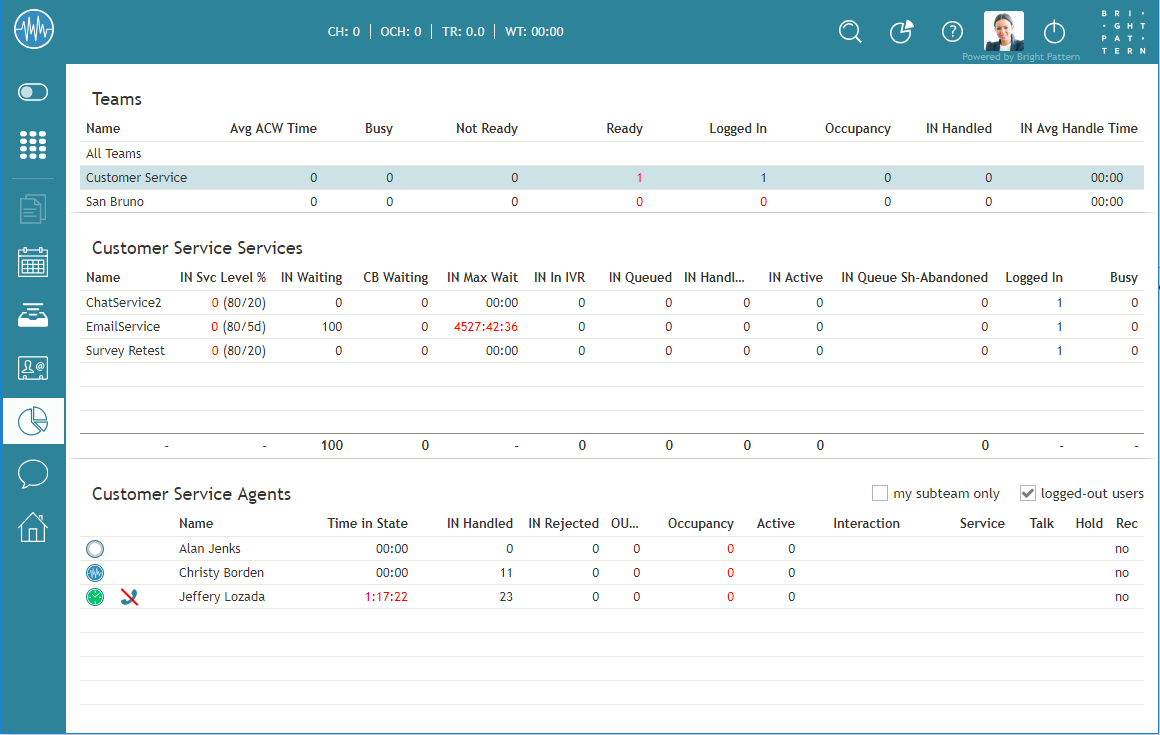
To view the service metrics for one team, select the desired team name from the available list of teams located at the top of the Context Information Area. Doing this will cause that team's service metrics to appear in the middle of the Context Information area. For any team selected, the name of the team appears next to the word "Services."
Service Metrics for All Teams
Selecting All Teams from the teams list will display the service metrics for all teams for which the supervisor is assigned to appear in the Context Information area. You can tell, at a glance, that the view includes service metrics for all teams by looking at the view's title, which shows "All Teams" next to the word "Services."


