Intraday Management
You can use the Intraday Management page to monitor real-time operational performance against forecasted metrics. This can help you identify deviations as they happen and take corrective action to ensure service level goals are met.
Prerequisites
Intraday Management requires that a forecast has been published for the skills and date range to be managed. Actual data from the live contact center is updated every 15 minutes.
Filtering Displayed Data by Skill and Date
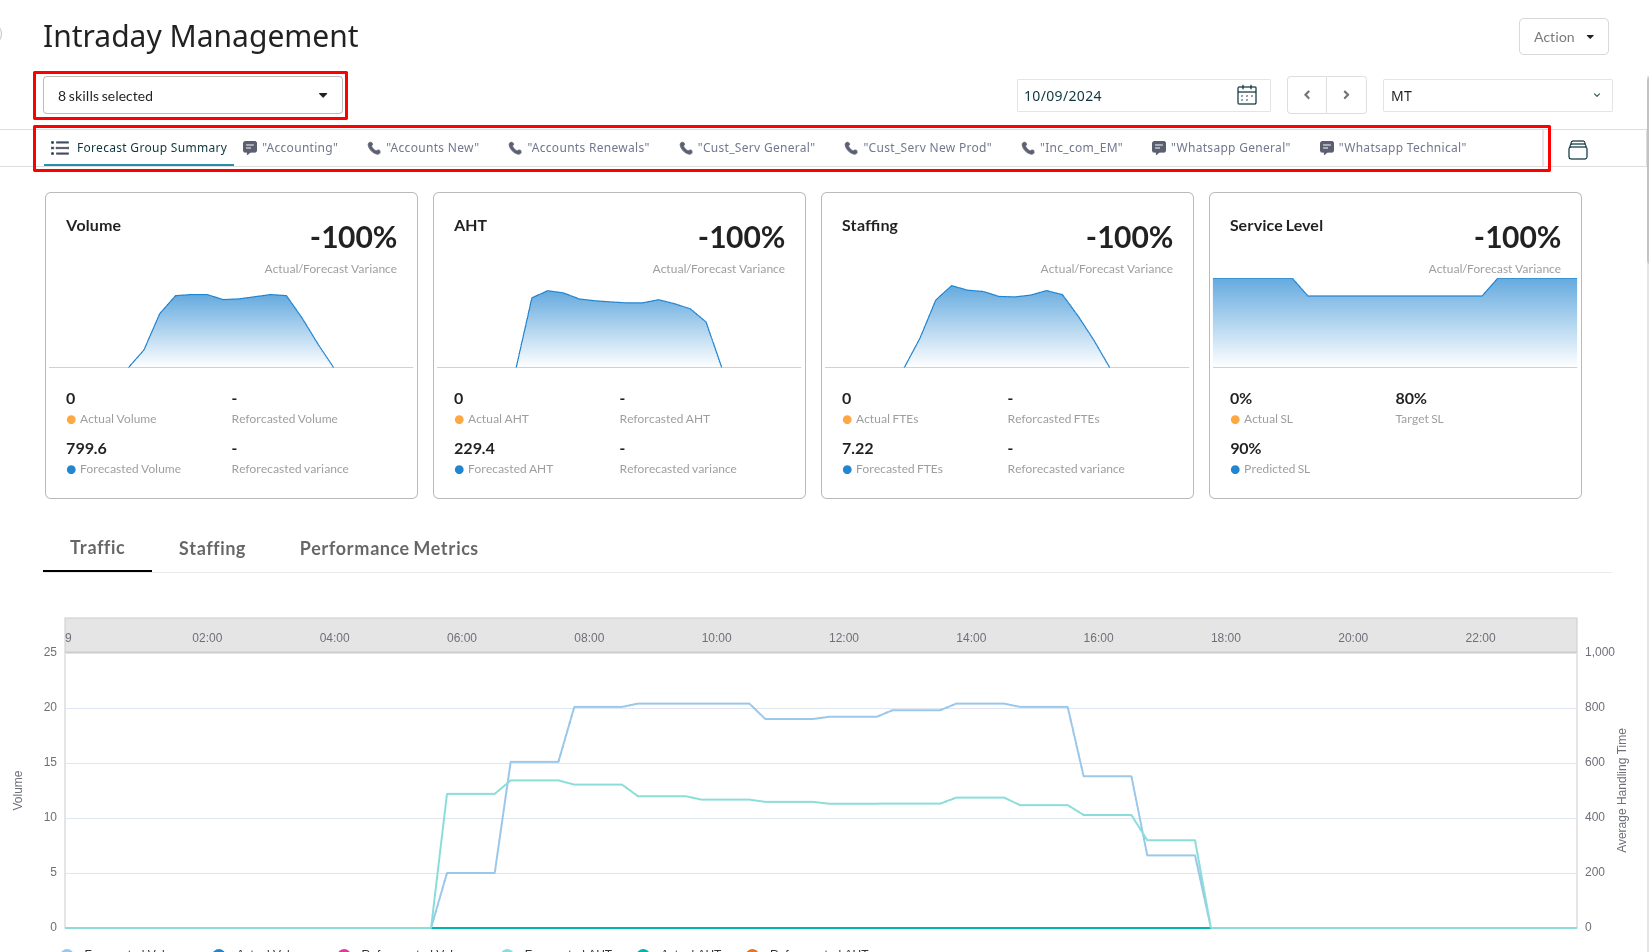
The data displayed on the page can be filtered by selecting the desired Skills. The Forecast Group Summary tab shows aggregated data for all selected skills, while individual tabs filter the display to show data for a single one of the selected skills.
In addition to filtering based on skills, you can view metrics for past days by using the date and time zone pickers:
- Date: Select the date you want to view using the date picker. By default, it shows today's date.
- Time Zone: The data is displayed in your local time zone by default, but you can select a different time zone from the dropdown menu.
Summary Widgets
The widgets at the top of the page provide an at-a-glance summary of Volume, AHT, and Staffing metrics for the selected skills and date.
- Volume, AHT, and Staffing widgets display the percentage variance between actual and forecasted values. They also show the underlying numbers for actual, forecasted, and reforecasted interactions.
- Service Level shows the actual service level achieved so far, and the predicted service level based on the current staffing and predicted volume.
Chart and Data Table
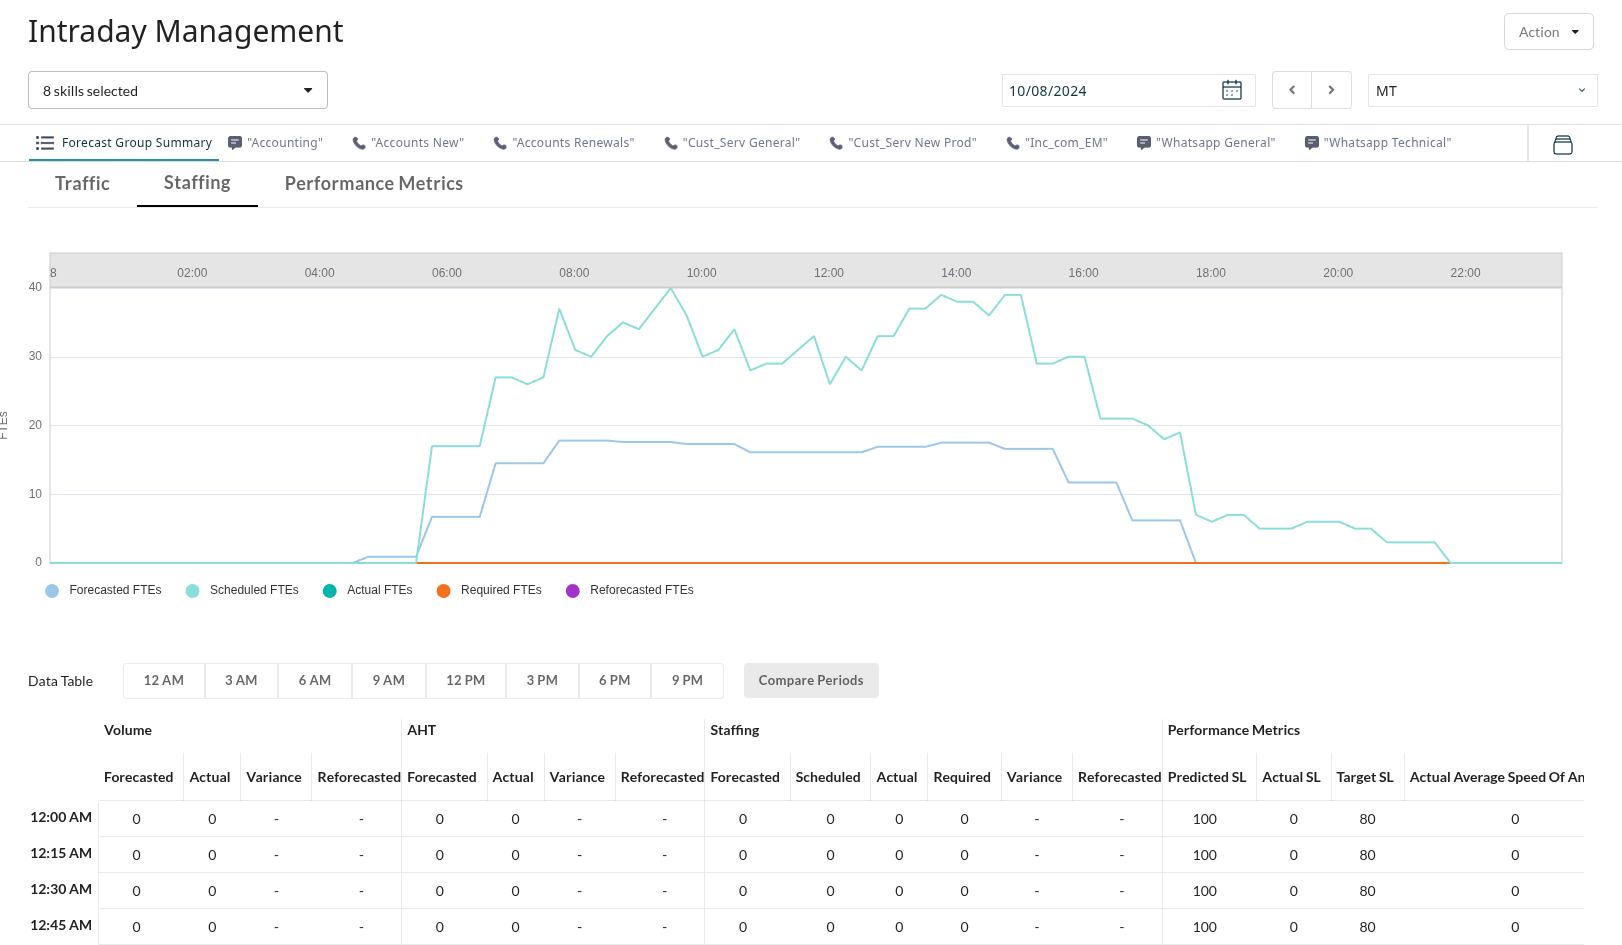
Beneath the widgets, a detailed view of Traffic, Staffing, and Performance Metrics is provided in an interactive chart and a data table.
- The interactive chart visualizes multiple data series (e.g., Forecasted Volume vs. Actual Volume) over a 24-hour period. Click on items in the legend to hide or show their corresponding lines in the chart to focus on specific metrics.
- The data table below the chart displays all values for each 15-minute interval. You can use the time shortcuts (e.g., 18:00) to quickly navigate the table or use the comparison tool to filter the table to show two distinct time periods side-by-side.
Actions
The Actions menu provides a number of additional tools to help you manage intraday operations, Reforecasting, Managing Alerts, Searching for Inactive IDs, and Exporting data.
Initiating a Reforecast
If actuals are deviating significantly from the forecast, you can initiate a reforecast for the remainder of the day using the Reforecast action. Reforecast types include:
- Use all intervals: Calculates the deviation based on all completed intervals since the start of the day.
- Use last X intervals: Calculates the deviation based on a more recent trend.
- Percentage adjustment: Manually enter a percentage change for volume and/or AHT.
The system generates a new forecast (the reforecast) for the rest of the day, which appears as a new line in the charts and tables.
Managing Alerts
To avoid constantly monitoring the screen, configure alerts that notify planners when performance deviates beyond a set threshold.
- From the Action menu, select Manage Alerts.
- Set the deviation thresholds for metrics like volume, AHT, or service level.
- When a threshold is breached, the system sends an alert, prompting the planner to review the Intraday Management page.
Inactive ID Search
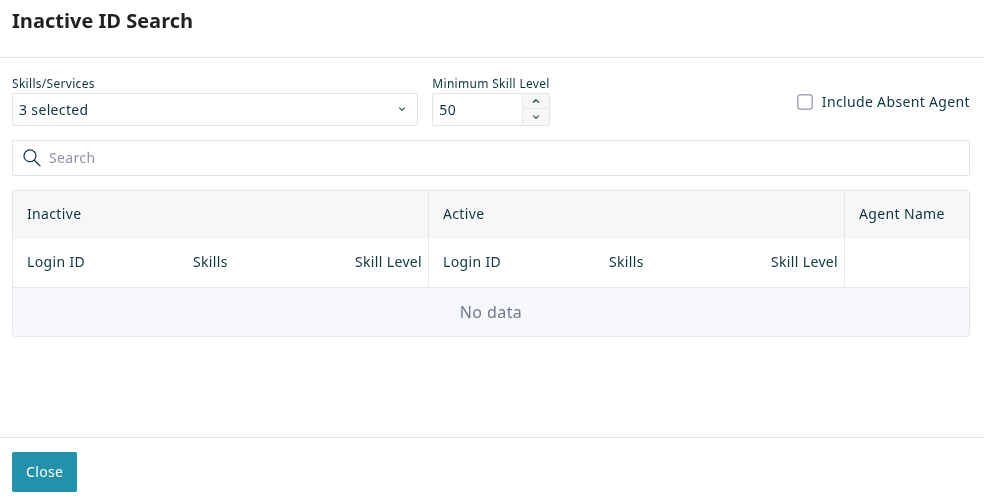
The Inactive ID Search helps you find agents with specific skills to cover immediate staffing needs. It displays a side-by-side comparison of active and inactive agents who meet the specified criteria.
- Use the filters at the top of the window to narrow down the agent pool.
- Skills/Services: Select one or more skills/services from the dropdown menu to find agents who possess them.
- Minimum Skill Level: Set the minimum proficiency level required for the selected skills.
- Include Absent Agent: Optionally, check this box to include agents who are scheduled as absent (e.g., on PTO) in the search results.
- Search: Use the search bar to further filter the results by agent name or login ID.
- Search results are displayed in a table that separates qualified agents into two categories:
- Inactive: Agents who meet the skill criteria but are not currently logged in.
- Active: Agents who meet the skill criteria and are currently logged in.
Export
Export the current view, including widgets, charts, and the data table, to a file for offline analysis or reporting.


