Real Time Adherence
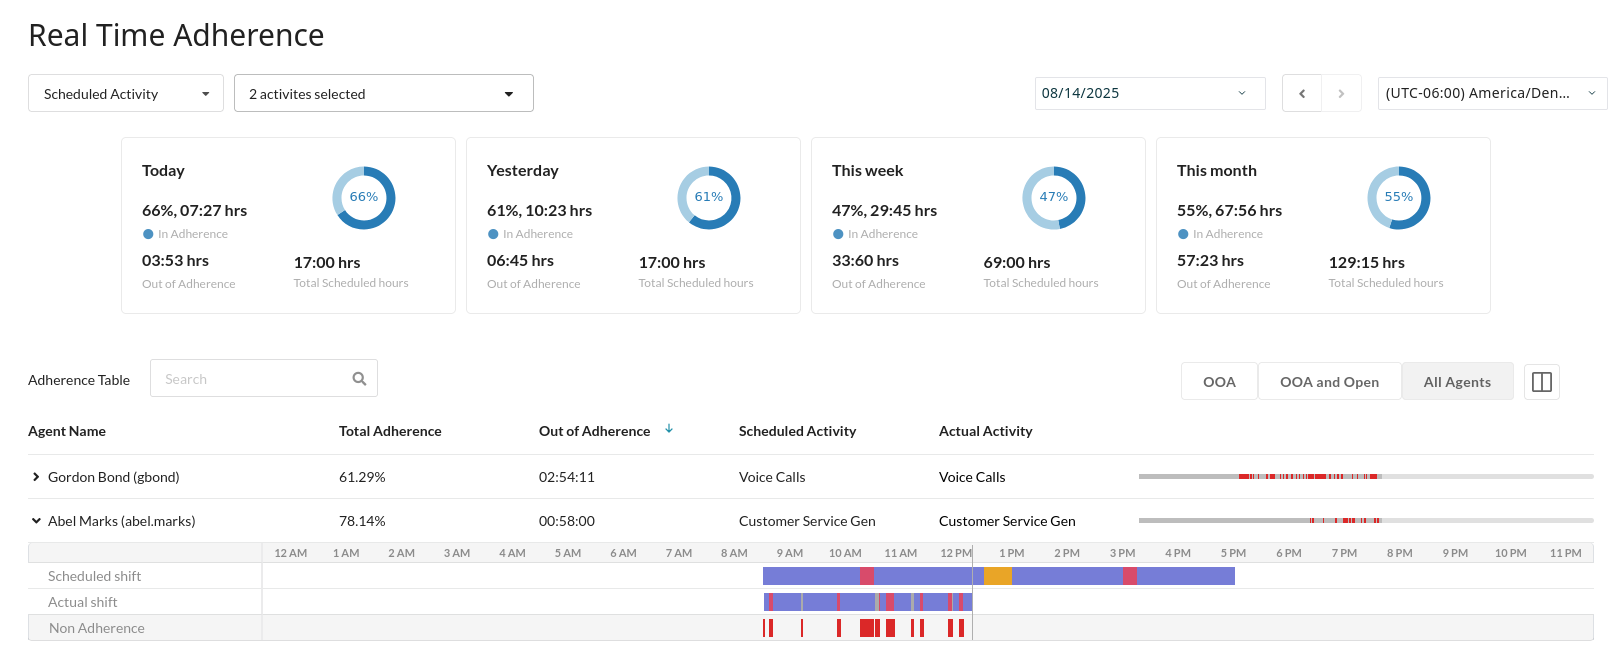
The Real Time Adherence page provides a live comparison of agents' scheduled activities to their actual activities. Use it to monitor schedule compliance and address discrepancies as they happen.
Prerequisites
To be displayed on this page, an agent must have a published schedule for the date being monitored.
Choose the Date and Agents to Review
Use the filters at the top of the page to choose the date, agents, and activities included in the data.
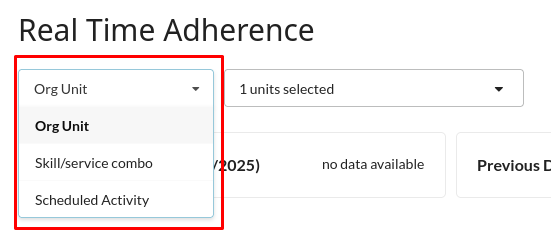
- Filter by Agent Group or Activity: Choose a filter category from the dropdown menu (such as Org Unit or Scheduled Activity), then use the adjacent field to select one or more specific items.
- Date and Time Zone: Use the date picker to view data for any of the past 30 days. All data is shown in your local time zone by default, but you can select another from the dropdown. The arrows move the view forward or backward by a single day.
Summary Adherence Widgets
The summary widgets at the top of the page provide a quick overview of adherence for four key time periods: selected date, preceding day, week-to-date, and month-to-date.
Each widget displays the following key metrics for its time period:
- Overall Adherence Percentage: The percentage of total scheduled time that agents were in an adherent state.
- In Adherence: The total time that agents were in adherence with their schedules.
- Out of Adherence: The total time that agents were not in adherence with their schedules.
- Total Scheduled Hours: The combined total of scheduled hours for all agents shown.
Adherence Table
This table displays a list of agents from the selected group or activity for the selected day.
Filtering the Agent Table
By default, the table shows only agents who are currently Out of Adherence (OOA). Use the view toggles to change the display:
- OOA (Out of Adherence): Shows only agents who are currently performing an activity for which they are not scheduled.
- OOA and Open: Narrows the view to out-of-adherence agents who are scheduled to be available for interactions.
- All Agents: Shows every agent in the filtered group, regardless of their adherence status.
Analyzing Agent Timelines
For a granular view, click the arrow (>) on an agent's row to display a more detailed timeline of their day.
This view contains the following timelines:
- Scheduled Shift: Shows the agent's planned activities.
- Actual Shift: Shows the agent's actual statuses over time.
- Non-Adherence: Red bars highlight discrepancies between the scheduled and actual shifts.
For any period of non-adherence, you can either justify the discrepancy or edit the shift itself:
- To justify a non-adherence: Click on the Non-adherence timeline, then use the slider to select all or part of the period and mark it as justified and add an excuse.
- To edit the shift: Click the Scheduled Shift timeline to open the shift editor and amend the agent's schedule.
< Previous | Next >


