Validating Historical Data
In WFM, data validation is the process of reviewing interaction volumes and Average Handle Time (AHT) statistics against a baseline of long-term historical averages. The goal is to identify and correct outliers: data points that deviate significantly from the norm due to unusual circumstances. For example, an outlier might be an interval with an unusually high or low number of interactions or an AHT that is far outside the typical range. The process also involves marking days with known special events (e.g., holidays, sales promotions) to account for their impact, especially for events that are likely to recur.
| Accurate staffing forecasts depend on properly validated historical data | ||
Procedure
Follow these steps to validate your historical data:
- Select Data for Validation and Reference
- Compare Data and Identify Outliers
- Normalize Outliers
- Mark Special Events
- Confirm Validated Data
Select Validation and Reference Periods
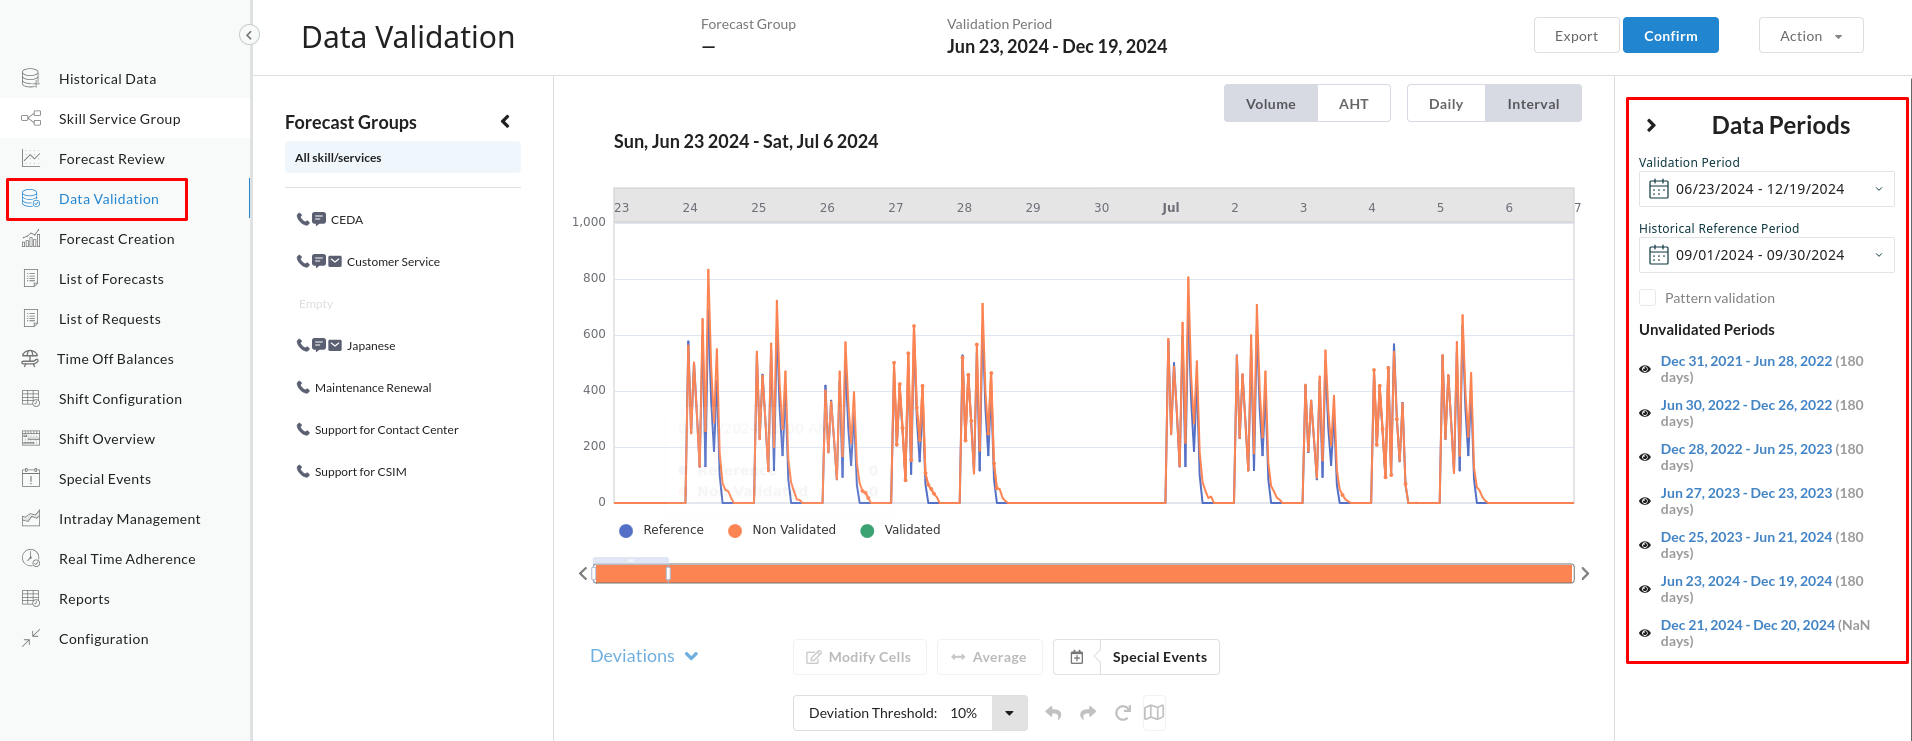
Navigate to the Data Validation page, and define a Validation Period and Historical Reference Period:
- Validation Period: The period of recent data for review and cleaning. Recent unvalidated periods are displayed in a list; clicking one populates the date selector. You may also input a custom date range.
- Historical Reference Period: The baseline period for comparison. The system averages this data to create a typical pattern, which appears as a blue line.
Compare Data and Identify Outliers
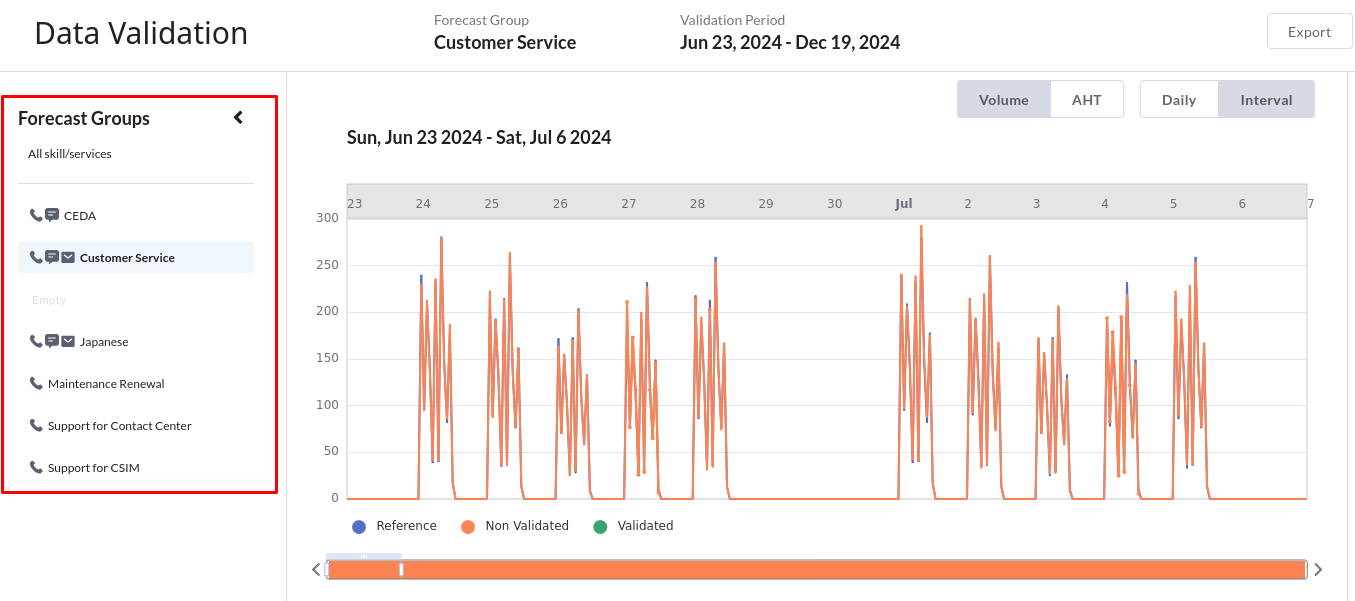
Once your periods are selected, analyze the data to find and process significant deviations. First, select the service you want to validate from the Forecast Groups menu. The graph and table will update to show data for your selection. Any validation changes you make will apply only to this group.
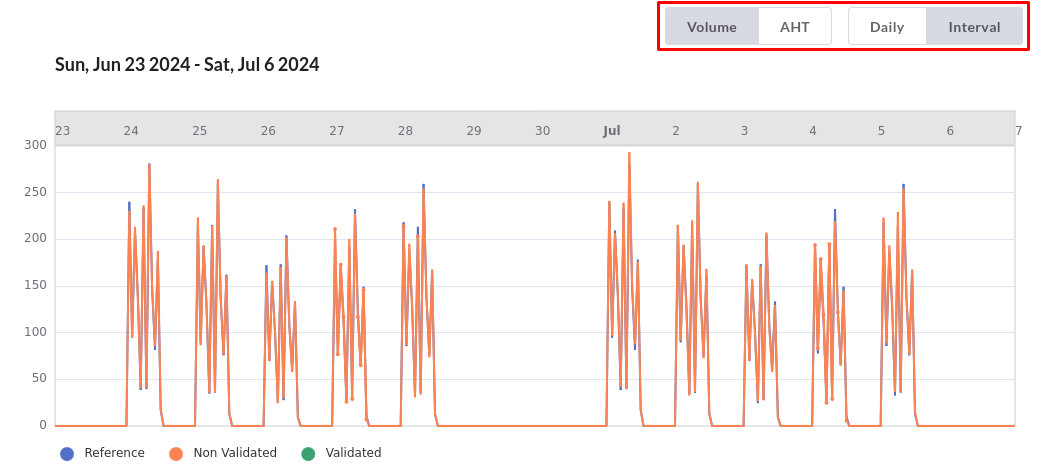
Once you've selected a service, use the toggles above the graph to switch your view. You can analyze deviations in interaction Volume or Average Handle Time (AHT), and set the data range to Daily or Interval.
Finding Deviations Visually
The graph provides an immediate visual representation of how your recent data compares to the historical average.
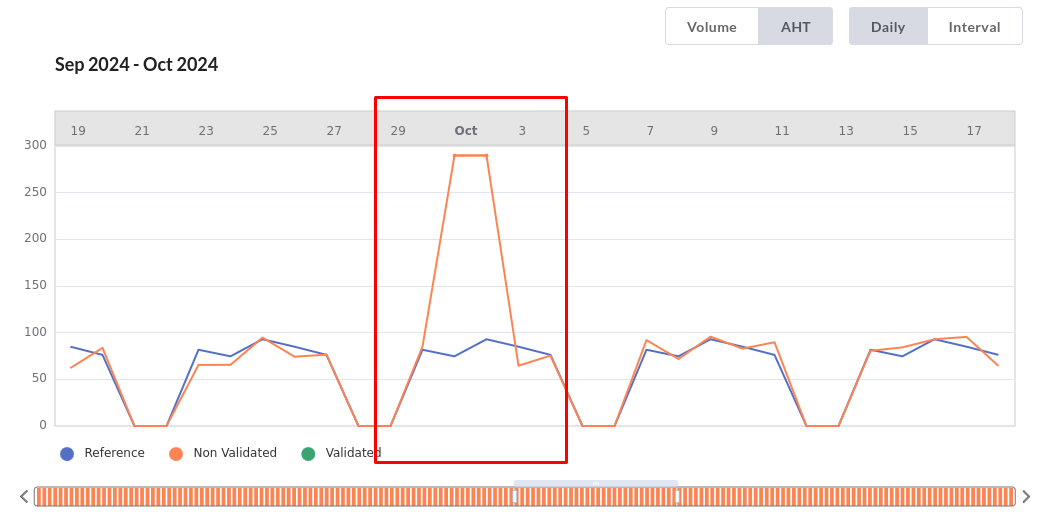
- Begin by comparing the validation data (red line) against the historical reference (blue line) in the graph.
- Look for significant spikes or dips where the red line diverges from the blue line's pattern.
- For instance, after selecting the AHT and Daily views, the graph below clearly shows a day where the AHT was unusually high compared to the reference average. This is an outlier that should be normalized.
Using Thresholds to Find Deviations
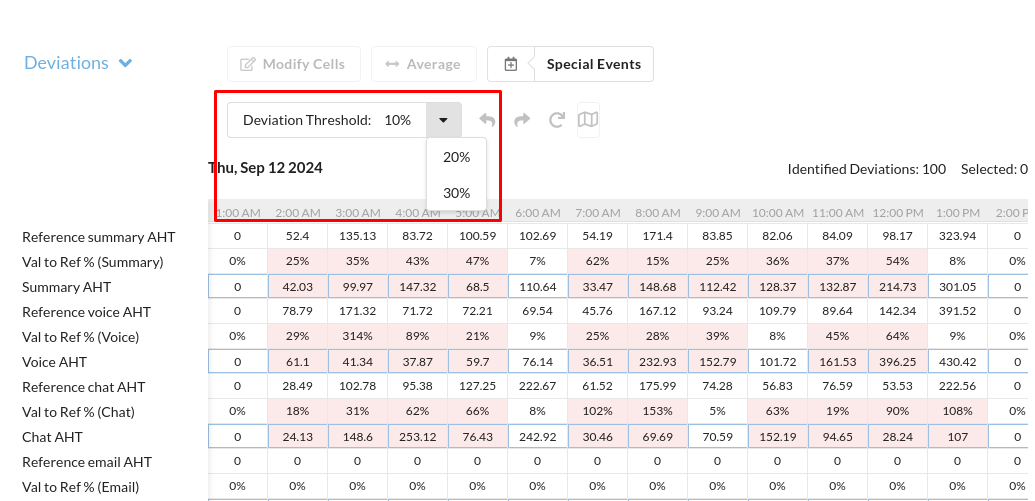
To highlight outliers in the data table below the graph, set a deviation Threshold percentage. Any interval where the validation data differs from the reference data by more than this threshold will be highlighted in red. This makes it easy to locate specific data points that need adjustment.
For each outlier, either normalize it or mark it as a special event.
Normalize Outliers
For each outlier, you can adjust its value to bring it in line with typical data.
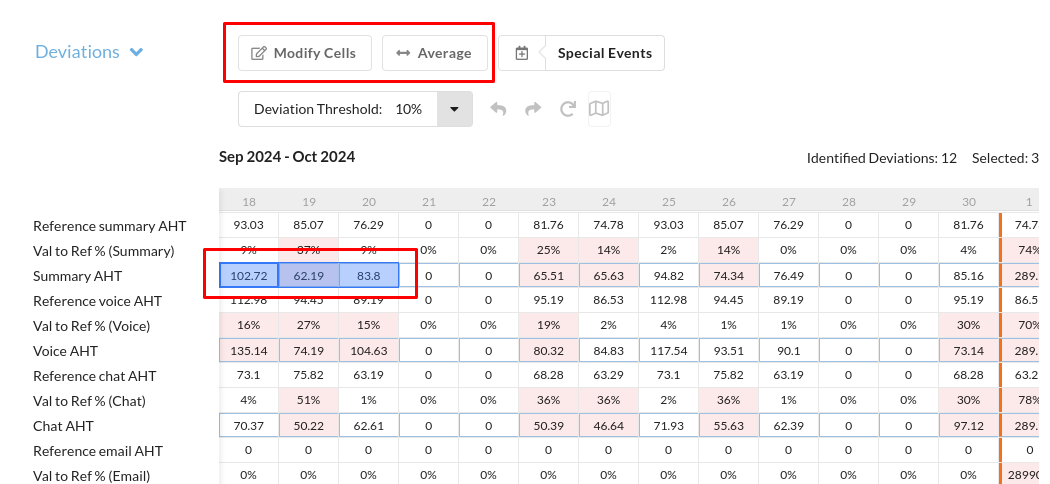
- Click a single cell to edit it directly. Enter a new value and press Enter.
- To select multiple cells, click and drag, or hold Ctrl (or Cmd) and click individual cells. With multiple cells selected, you can change them all at once using the Modify Cells or Average button.
- The Modify Cells dialog includes the following options:
- By Percentage (%): Increase or decrease all selected values by a set percentage.
- By Total (Σ): Replace the sum of the selected cells with a new total, which is then distributed proportionally.
- Smoothing can be used in two ways:
- As a Modifier: When combined with a Percentage or Total adjustment, the Smoothing value applies the change gradually, creating a ramp-up and ramp-down effect over the specified number of days around the selected period.
- As a Standalone Action: If you only enter a number of Smoothing days without a Percentage or Total, the system applies a moving average to the selected cells. The new value for each day is the average of that day and the surrounding days in the smoothing period. For example, a smoothing factor of 3 calculates Tuesday's new value as the average of Monday, Tuesday, and Wednesday.
- Average: Replace the value in each selected cell with the average of all selected cells. This is useful for periods with high variance.
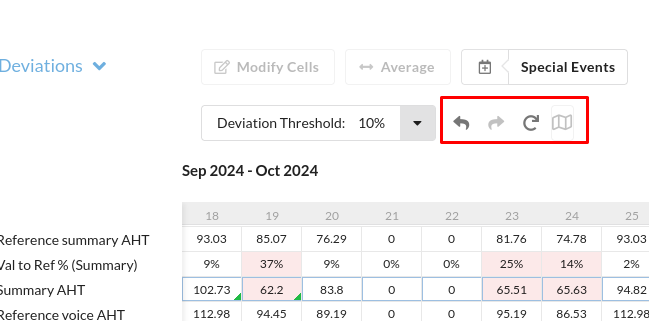
- Any cell you modify will be marked with a green triangle. To manage your changes, use the toolbar icons located above the data table.
- Undo (↶): Reverts the most recent change you made.
- Redo (↷): Re-applies the last change that you undid.
- Reset (circular arrow): Reverts all modifications made during the current validation session for the selected period.
Mark Special Events
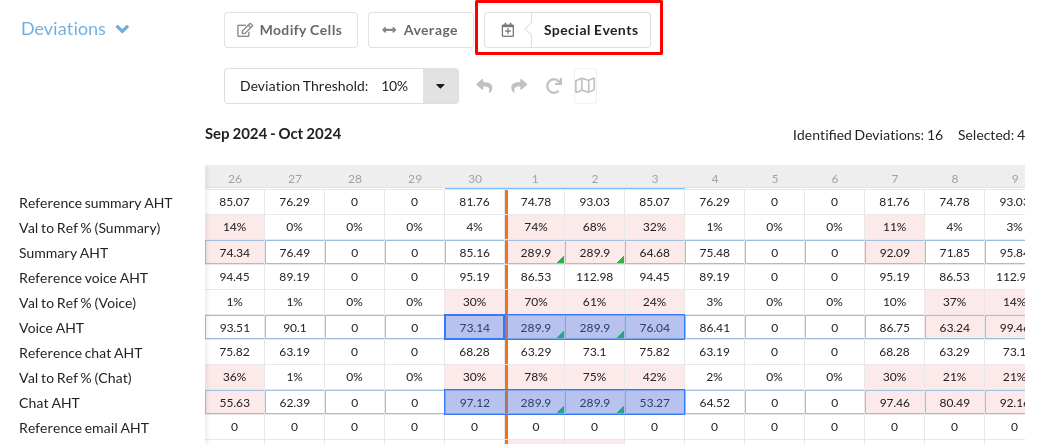
If a deviation was caused by a known event (e.g., a holiday or a sales promotion), mark it as a Special Event. This allows the system to record the event's statistical impact and apply it to future forecasts if the event reoccurs.
- Select the cell or range of cells in the data table and click the Special Events button.
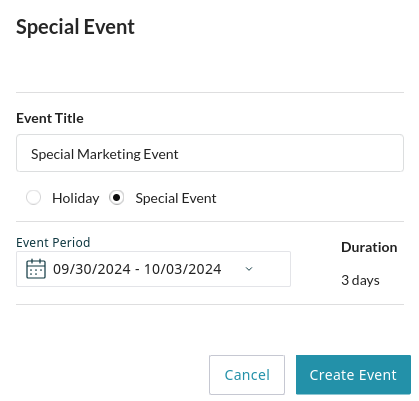
- In the dialog that appears, configure the event:
- Enter an Event Title.
- Select the event type (Holiday or Special Event).
- Confirm the Event Period.
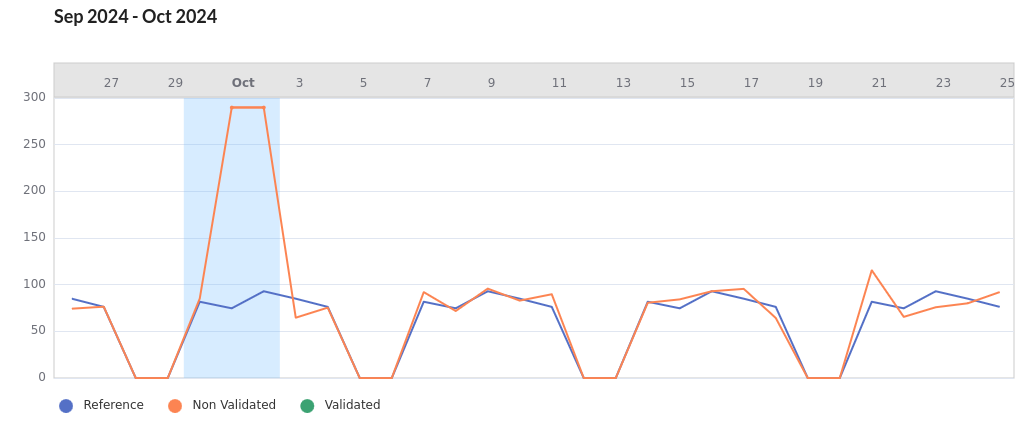
- Click Create Event. The specified period will be highlighted in the graph in light blue, indicating the time period the event covers.
Confirm Validated Data
After reviewing and normalizing the data, click Confirm. This saves your changes and stores the data as a validated dataset for forecasting. The data line in the graph turns from red to green, indicating it is validated.

