提供: Bright Pattern Documentation
(Created page with "=== シリーズのタイプ === 表示に使用できるシリーズタイプには、''サービス''と''チーム''の2つのシリーズがあります。シリーズタ...") |
|||
| (3 intermediate revisions by the same user not shown) | |||
| Line 15: | Line 15: | ||
表示に使用できるシリーズタイプには、''サービス''と''チーム''の2つのシリーズがあります。シリーズタイプは、Y軸に統計データとして表示されます。各統計データの値は、統計タイプごとに記録されます。シリーズタイプの統計データは次のとおりです。 | 表示に使用できるシリーズタイプには、''サービス''と''チーム''の2つのシリーズがあります。シリーズタイプは、Y軸に統計データとして表示されます。各統計データの値は、統計タイプごとに記録されます。シリーズタイプの統計データは次のとおりです。 | ||
| − | ==== | + | ==== サービス統計データ ==== |
{|border="1" style="border-collapse:collapse" cellpadding="5" | {|border="1" style="border-collapse:collapse" cellpadding="5" | ||
| − | | | + | |統計 |
| − | | | + | |値 |
|- | |- | ||
| − | |[[Reporting-reference-guide/AllMetrics#Inbound_Interactions_Currently_in_Queue_.28IN_Waiting.29| | + | |[[Reporting-reference-guide/AllMetrics#Inbound_Interactions_Currently_in_Queue_.28IN_Waiting.29|現在キューイング中の受信対話件数]] |
| − | | | + | |コールの件数 |
|- | |- | ||
| − | |[[Reporting-reference-guide/AllMetrics#Inbound_Calls_in_IVR.2C_Queue_or_on_Agents_Now_.28IN_Calls_in_Progress.29| | + | |[[Reporting-reference-guide/AllMetrics#Inbound_Calls_in_IVR.2C_Queue_or_on_Agents_Now_.28IN_Calls_in_Progress.29|現在IVR中・キューイング中・エージェントによる処理中の受信対話件数]] |
| − | | | + | |コールの件数 |
|- | |- | ||
| − | |[[Reporting-reference-guide/AllMetrics#Percentage_of_Inbound_Interactions_Answered_in_Service_Level_Over_20_Most_Recent_Calls_.28IN_Svc_Level_.25_or_SLA.29| | + | |[[Reporting-reference-guide/AllMetrics#Percentage_of_Inbound_Interactions_Answered_in_Service_Level_Over_20_Most_Recent_Calls_.28IN_Svc_Level_.25_or_SLA.29|サービスレベル(移動ウィンドウ)で応答された受信対話件数]] |
| − | | | + | |コールの件数 |
|- | |- | ||
| − | |[[Reporting-reference-guide/AllMetrics#Inbound_Calls_Currently_in_IVR_.28IN_in_IVR.29| | + | |[[Reporting-reference-guide/AllMetrics#Inbound_Calls_Currently_in_IVR_.28IN_in_IVR.29|現在IVR中の受信対話件数]] |
| − | | | + | |コールの件数 |
|- | |- | ||
| − | |[[Reporting-reference-guide/AllMetrics#Inbound_Interactions_Received_for_the_Day_.28IN_Received.29| | + | |[[Reporting-reference-guide/AllMetrics#Inbound_Interactions_Received_for_the_Day_.28IN_Received.29|受信した対話件数]] |
| − | | | + | |コールの件数 |
|- | |- | ||
| − | |[[Reporting-reference-guide/AllMetrics#Inbound_Calls_Abandoned_for_the_Day_.28IN_Total_Abandoned.29| | + | |[[Reporting-reference-guide/AllMetrics#Inbound_Calls_Abandoned_for_the_Day_.28IN_Total_Abandoned.29|放棄された受信コール件数]] |
| − | | | + | |コールの件数 |
|} | |} | ||
| − | ==== | + | ==== チーム統計データ ==== |
{|border="1" style="border-collapse:collapse" cellpadding="5" | {|border="1" style="border-collapse:collapse" cellpadding="5" | ||
| − | | | + | |統計 |
| − | | | + | |値 |
|- | |- | ||
| − | |[[Reporting-reference-guide/AllMetrics#Busy_Agents_.28Busy.29| | + | |[[Reporting-reference-guide/AllMetrics#Busy_Agents_.28Busy.29|取り込み中のマッチングエージェント数]] |
| − | | | + | |エージェント数 |
|- | |- | ||
| − | |[[Reporting-reference-guide/AllMetrics#Logged-in_Agents_.28Logged_In.29| | + | |[[Reporting-reference-guide/AllMetrics#Logged-in_Agents_.28Logged_In.29|ログイン中のマッチングエージェント数]] |
| − | | | + | |エージェント数 |
|- | |- | ||
| − | |[[Reporting-reference-guide/AllMetrics#Agents_Ready_.28Ready.29| | + | |[[Reporting-reference-guide/AllMetrics#Agents_Ready_.28Ready.29|受付可能なマッチングエージェント数]] |
| − | | | + | |エージェント数 |
|- | |- | ||
| − | |[[Reporting-reference-guide/AllMetrics#Not_Ready_Agents_.28Not_Ready.29| | + | |[[Reporting-reference-guide/AllMetrics#Not_Ready_Agents_.28Not_Ready.29|受付不可のマッチングエージェント数]] |
| − | | | + | |エージェント数 |
|- | |- | ||
| − | |[[Reporting-reference-guide/AllMetrics#Occupancy_in_Campaign.2FService_.28Occupancy.29| | + | |[[Reporting-reference-guide/AllMetrics#Occupancy_in_Campaign.2FService_.28Occupancy.29|マッチングエージェントの稼働率]] |
| − | | | + | |パーセンテージ |
|} | |} | ||
| − | === | + | === タイムレンジ === |
| − | + | サービスモニタリングとチームモニタリングの場合、次の間隔をチャートのX軸に表示できます。 | |
| − | * | + | * 5分間 |
| − | * | + | * 15分間 |
| − | * | + | * 1時間 |
| − | * | + | * 3時間 |
| − | * | + | * 6時間 |
| − | * | + | * 12時間 |
| − | * | + | * 24時間 |
| − | * | + | * 2日間 |
| − | * | + | * 7日間 |
Latest revision as of 16:03, 2 December 2019
• English
タイムシリーズウィジェット
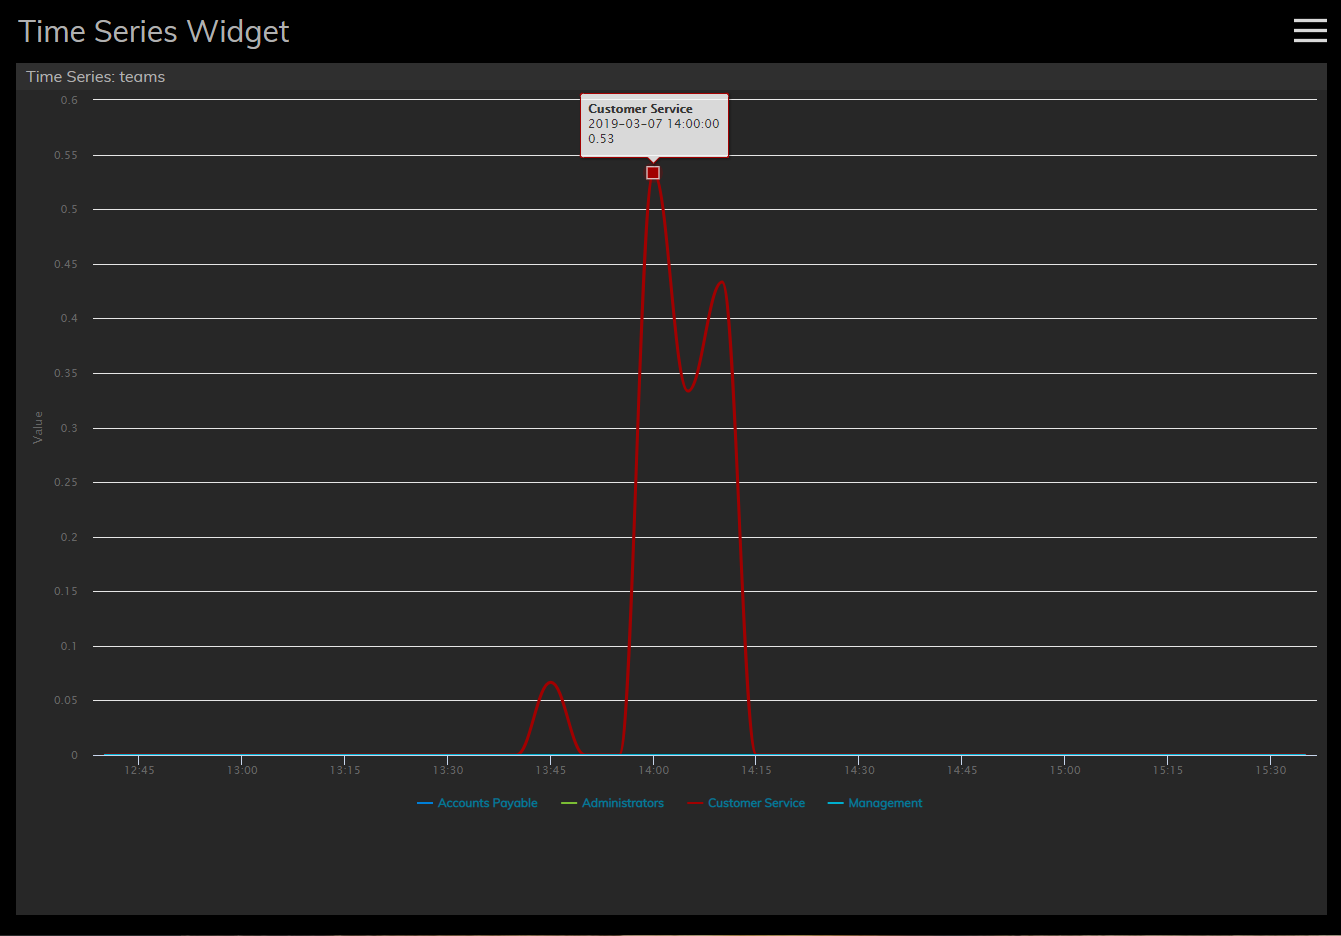
タイムシリーズウィジェットは、チームまたはサービス関連のメトリックのデータを表示し、それらを一定の時間間隔でグラフ化します。各統計データはチャートのY軸(つまり垂直)に表示され、選択された時間間隔はチャートのX軸(つまり水平)に表示されます。視覚的にわかりやすく表現されたデータ により、パフォーマンスを一目で監視し、短期または長期にわたって分析できます。
設定
ウォールボードのカスタマイズという権限を付与されたユーザーは、ウォールボードウィジェットのコントロール設定を編集できます。タイムシリーズの設定は以下の通りです。
タイトル
タイトルの設定により、ウィジェットに名前を付けることができます。
シリーズのタイプ
表示に使用できるシリーズタイプには、サービスとチームの2つのシリーズがあります。シリーズタイプは、Y軸に統計データとして表示されます。各統計データの値は、統計タイプごとに記録されます。シリーズタイプの統計データは次のとおりです。
サービス統計データ
| 統計 | 値 |
| 現在キューイング中の受信対話件数 | コールの件数 |
| 現在IVR中・キューイング中・エージェントによる処理中の受信対話件数 | コールの件数 |
| サービスレベル(移動ウィンドウ)で応答された受信対話件数 | コールの件数 |
| 現在IVR中の受信対話件数 | コールの件数 |
| 受信した対話件数 | コールの件数 |
| 放棄された受信コール件数 | コールの件数 |
チーム統計データ
| 統計 | 値 |
| 取り込み中のマッチングエージェント数 | エージェント数 |
| ログイン中のマッチングエージェント数 | エージェント数 |
| 受付可能なマッチングエージェント数 | エージェント数 |
| 受付不可のマッチングエージェント数 | エージェント数 |
| マッチングエージェントの稼働率 | パーセンテージ |
タイムレンジ
サービスモニタリングとチームモニタリングの場合、次の間隔をチャートのX軸に表示できます。

