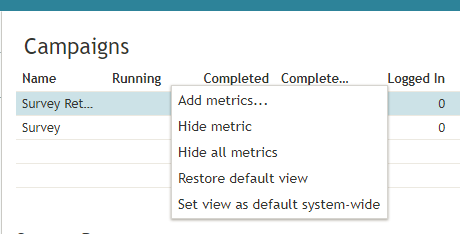
Customization of Metric Views
Depending on your permissions, you may be able to customize real-time metric views by removing undesired metrics, adding other metrics that you may want to see, and changing the order in which metrics are arranged in the table. You may also be able to set such a customized view as a default view for all other supervisors of your contact center.
Adding and Removing Metrics
To remove a particular metric:
- Hover your cursor over the corresponding column name and click the drop-down menu icon
 that will appear.
 - Select the Hide metric option.
To add a metric:
- Hover your cursor over the name of the column next to where you want to add this new metric, and click the drop-down menu icon
 that will appear.
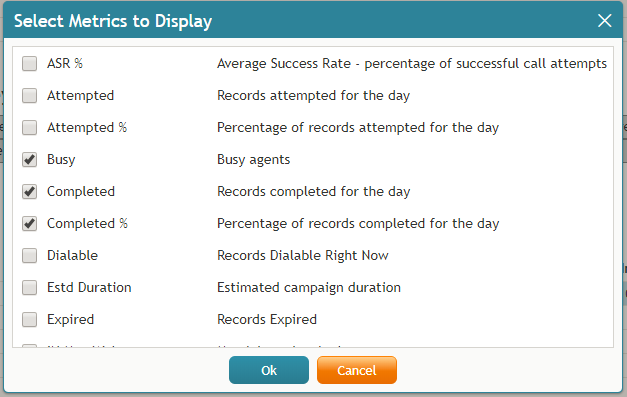
 - Select the Add metrics… option. A list of available metrics will appear with checkboxes next to their names.
- Locate the desired metric in the list and select its checkbox.
- Click OK.
Rearranging Metrics Columns and Reverting to Default Views
To rearrange the order of columns in the metrics view, use the mouse to click on and drag the name of the columns to the desired locations.
You can also restore the original metrics set with the original order of columns. To do so, open the drop-down menu next to any metric and click the Restore default view option.
Saving a New Default View
Once you have completed all of the desired configuration changes, you can set the new view as the new default view for all other supervisors of your contact center. To do so, open the drop-down menu next to any metric and click the Set view as default system-wide setting. Note that this function requires a separate permission.
The list of metrics that appears when you click the Add metric… option contains brief descriptions for all real-time metrics available for the selected object (service, campaign, or agent). For the descriptions of metrics currently displayed in the metrics views, you can simply hover over the corresponding column titles.
For more detailed metric descriptions, follow these links:


