From Bright Pattern Documentation
Customizing Team Metrics
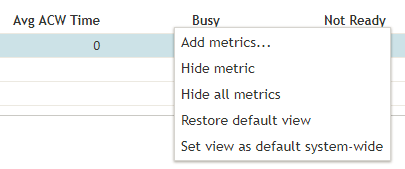
When you move your cursor over the service names, right-clicking or clicking the "down" ![]() icon will bring up a drop-down menu that gives several options. You can hide metrics, add metrics, hide all metrics, or restore the default view. If you do not remember the changes you made (i.e., you hid a metric, want to add it back, but you do not remember the name of the metric), you may restore the default view to make all metrics visible that were originally set in Agent Desktop.
icon will bring up a drop-down menu that gives several options. You can hide metrics, add metrics, hide all metrics, or restore the default view. If you do not remember the changes you made (i.e., you hid a metric, want to add it back, but you do not remember the name of the metric), you may restore the default view to make all metrics visible that were originally set in Agent Desktop.

To hide some metrics (e.g., hide overflow metrics assigned to your team in order to focus on your core metrics):
- Mouse over the corresponding metric name, and click the drop-down menu icon that will appear.
- Select the Hide metric option.
To add hidden metrics:
- Mouse over the name of the metric below which you wish the hidden metric to appear, and click the drop-down menu icon that will appear.
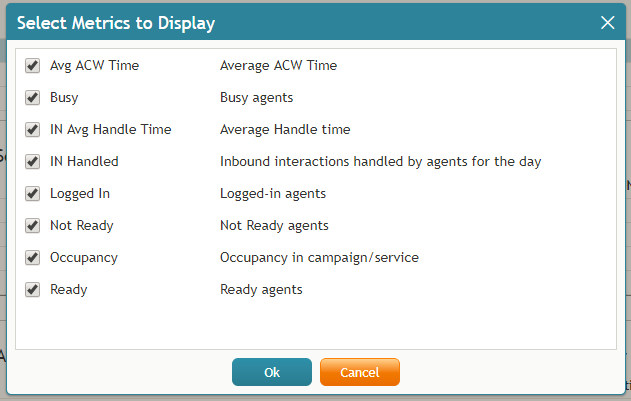
- Select the Add metric… option. A list of metrics will appear with checkboxes next to their names.
- Locate the desired metric in the list and select its checkbox.
- Click OK.
