Eval Console Overview
Eval Console, accessible through Eval Home, is where evaluations happen. To access the console, double-click on any interaction record from an Eval Home search result; the console will pop a new tab that displays the name of the agent from the interaction.
The console contains all the tools an evaluator needs to effectively review interactions; tools include call recordings, screen recordings, transcripts, and evaluation forms, with the functionality to attach comments to any item shown. This streamlined presentation helps quality evaluators to comment and grade agent interactions while viewing and listening to the interactions themselves. Recordings show a timeline of the interaction, whether the customer or agent is speaking, and when the interaction was recorded. You can loop segments, go back or fast-forward, attach comments to specific parts, download and share recordings, and much more.
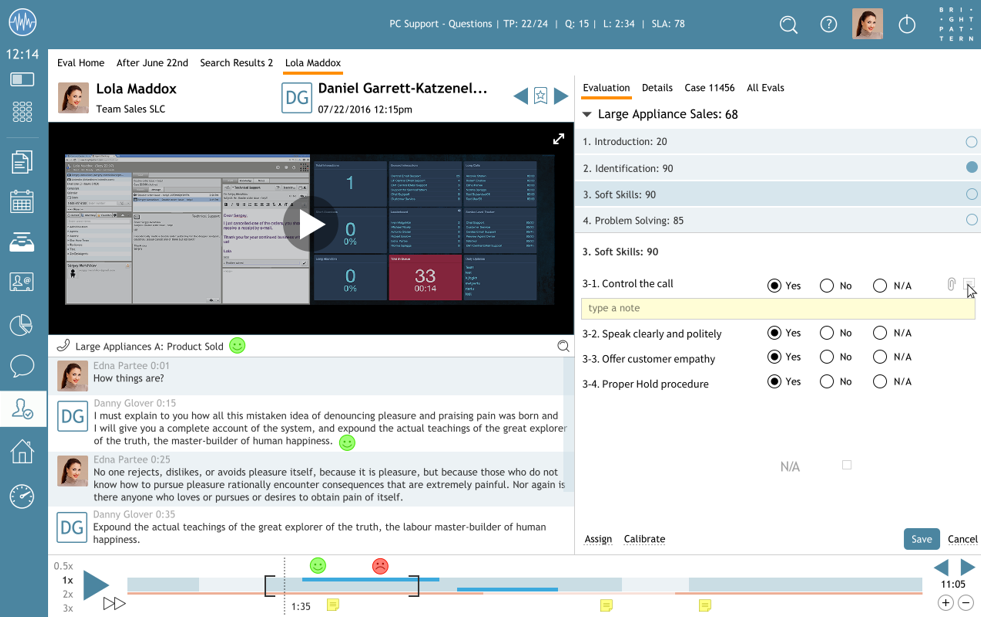
The following is an overview of the Eval Console interface, including sections and controls.
User Interface
The Eval Console screen is divided into the following sections:
- The header, located at the top, left-hand side of the screen
- The screen recording display, located on the screen's left side
- The transcript display, located on the sceen's left side
- The timeline, located at the bottom of the screen
- The evaluation area, located on the right side of the screen
Note that the screen and transcript display areas are separated from the evaluation area by a splitter that is adjustable.
Header
The header displays basic interaction information including the agent's name, what team they are on, the customer's name (i.e., if a saved contact) or the phone number/email address (i.e., if the contact is anonymous), and the date and time of the interaction. Additionally, the header contains navigation icons and the bookmark feature.
The navigation icons allow you to browse through the interactions list from an individual search results screen. The back icon navigates backward through the list; the forward
icon navigates forward through the list.
Bookmark
The bookmark icon allows you to mark an interaction for quick reference. Your bookmarked cases are accessible through the Bookmarks search preset button. When a case is not bookmarked, the icon will display as empty ; when a case is bookmarked, the icon will display as filled
.
Screen Recording Display
If screen recording is enabled for your contact center, you will be able to view a recording of the user's screen from the time of the interaction. The screen recording area shows a blurry, static picture unless the play button is clicked; the recording then syncs to the timeline when it is played. Note that it is possible to stop the screen playback by clicking the stop
icon; the timeline will continue to play.
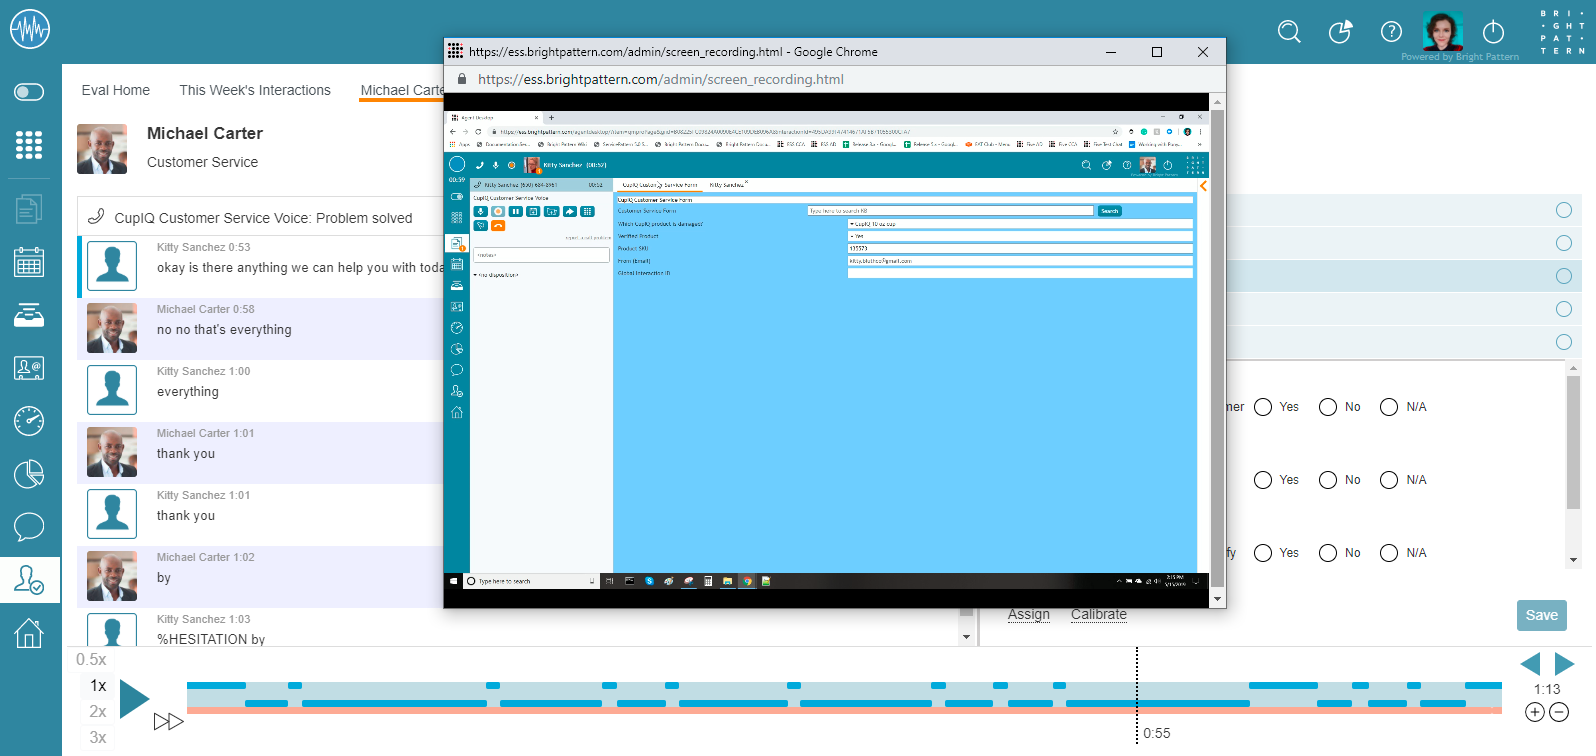
Should you wish to expand the recording display, it is possible to pop the screen out into a separate browser window. To do this, click the expand icon. To pop the display back into the console, simply close the separate browser window.
Transcript Display
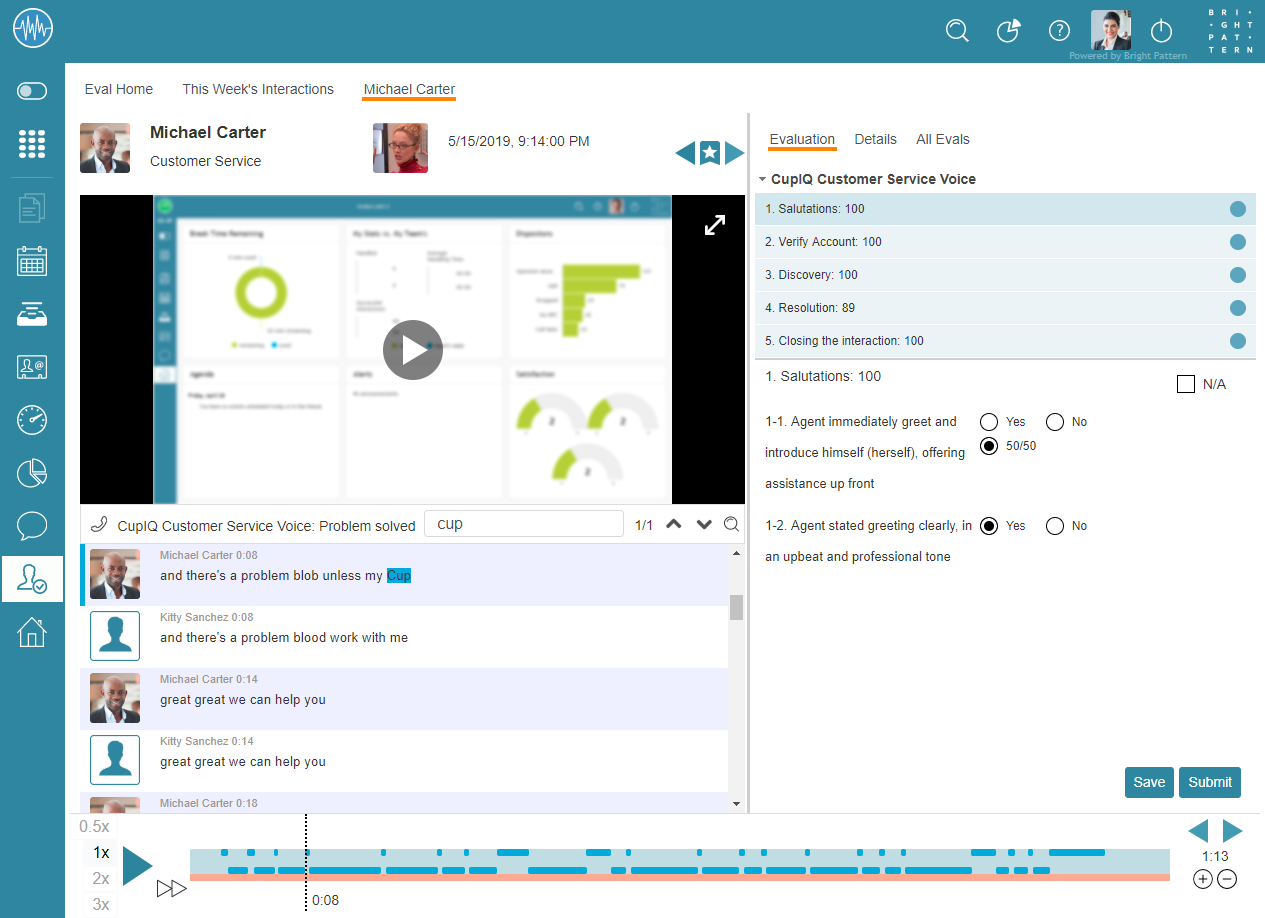
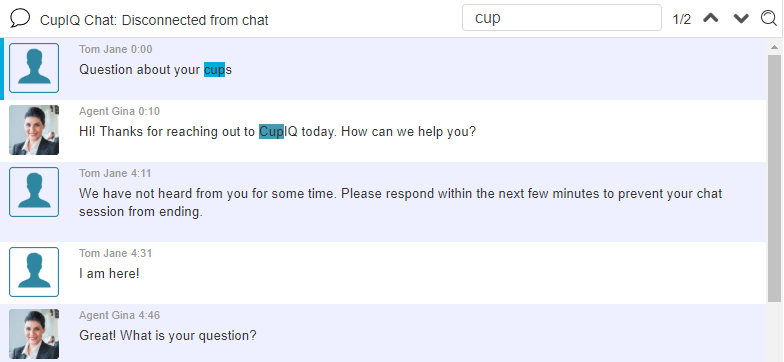
The transcript display area shows not only text from interactions, but displays icons indicating media type, the name of the service the interaction happened on, and dispositions (i.e., for chat and voice). Additionally, the transcript display area contains a search feature which can help you quickly locate important words or phrases from the transcript.
Depending on the interaction type, the display varies:
- For chat interactions, the entire interaction is displayed, including system responses.
- For email interactions, the entire email thread will be displayed up until the most recently completed response.
- For voice interactions, a transcript of the call will be displayed from the time that the call is connected to the agent. Note that you will need to configure a Speech To Text (STT) integration for your contact center to make interaction transcripts display.
Transcript Search
The transcript search function lets you search through the transcript text for matching words or phrases. To use the transcript search function, click the search icon and a search field will appear. When you type in the field, a counter will display the number of matching instances; each instance will be highlighted. To jump to the matching instances in the transcript, click the down
icon; to jump back to earlier instances, click the up
icon.
Timeline
The timeline controls the interaction playback. When the play button is selected, all available segments (i.e., screen recording, transcript, and audio) of the interaction sync together, allowing you to review the interaction as if in real time. Additionally, the timeline contains a number of controls that allow you to manipulate the interaction playback for more accurate evaluations. For voice interactions, note that call recording must be enabled in order to listen to call audio.
Timeline Display
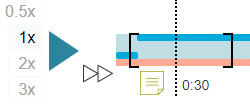
The timeline display comprises visual indicators that let you know both what happened during the interaction and what is happening as you review the interaction; these include the following:
- When the interaction is played, the dotted playback indicator displays where in the timeline you are.
- The dark blue line shows who speaks when (i.e., for voice) or when a message was sent (i.e., for chat); the line length indicates the amount of time each party spoke/ interacted.
- A light blue background indicates a voice interaction was put on hold and/or silence.
- The orange line on the bottom indicates that there was screen recording.
- The light orange line on the bottom indicates that there was no screen recording.
- If Natural Language Understanding is used in your contact center, sentiment icons for customer segments are displayed on the timeline.
- If a note is made for an evaluation form question, a note
icon is displayed below the timeline; the note will appear on the timeline where the evaluator's playback indicator was at the time the note was made.
- For voice and chat interactions, the interaction's total time length is displayed on the right side of the timeline.
Timeline Playback Controls
The timeline playback controls include the following:
- The play
button - This button begins playback; it is located on the left side of the timeline.
- The pause
button - This button pauses playback; it is located on the left side of the timeline and is seen only after the play button is selected.
- Playback speed controls - These clickable controls allow you to speed up or slow down the speed of the recording playback; options include 0.5x (slowest), 1x, 2x, and 4x (fastest).
- The skip
button - This allows you to skip through segments of the playback where the call was on hold or where there was silence.
- The Next segment
button - If a consultation or transfer was conducted, this button allows you to skip though the recording to the next agent segment.
- The Previous segment
button - If a consultation or transfer was conducted, this button allows you to go back through the recording to the previous agent segment.
- The zoom in
button - Clicking this allows you to zoom in on the segment of the timeline the dotted playback indicator is on; zooming in on a segment adds a scroll bar to the bottom of the timeline.
- The zoom out
button - Clicking this allows you to zoom out on the timeline.
Creating Playback Loops
Occasionally, you may need to review interactions with poor audio quality. In instances such as this, you may create playback loops. Playback loops allow you to set starting and ending points that you can listen to repeatedly. To create a playback loop, do the following:
- Create the starting point by holding the SHIFT key and clicking on the timeline; a bracket will appear (i.e., [).
- Create the ending point by holding the SHIFT key and right-clicking on the timeline; a bracket will appear (i.e., ]).
- Click the play button and the segment will play repeatedly until paused or the brackets are removed.
- To remove the playback loop, click on the timeline outside of the brackets.
Evaluation Section
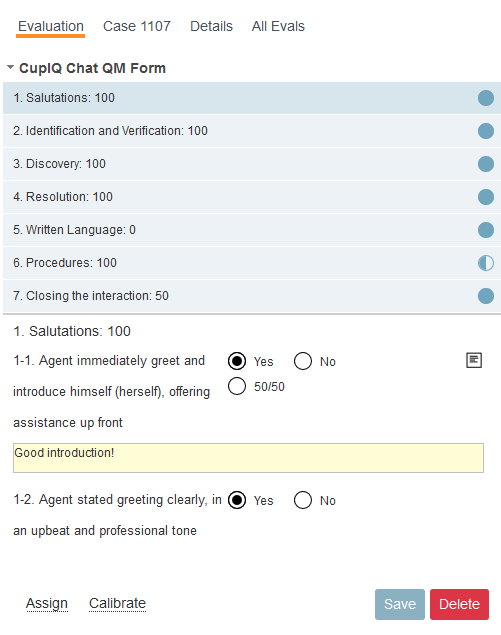
The evaluation section is where evaluators not only fill out evaluation forms but may view related cases, leave comments, download interaction audio and video files, view all evaluations, and so forth. Additionally, if your privileges allow, you may assign evaluators to interactions or assign them for calibration purposes.
For more information, see Conducting Evaluations.

