提供: Bright Pattern Documentation
• English
タイムシリーズウィジェット
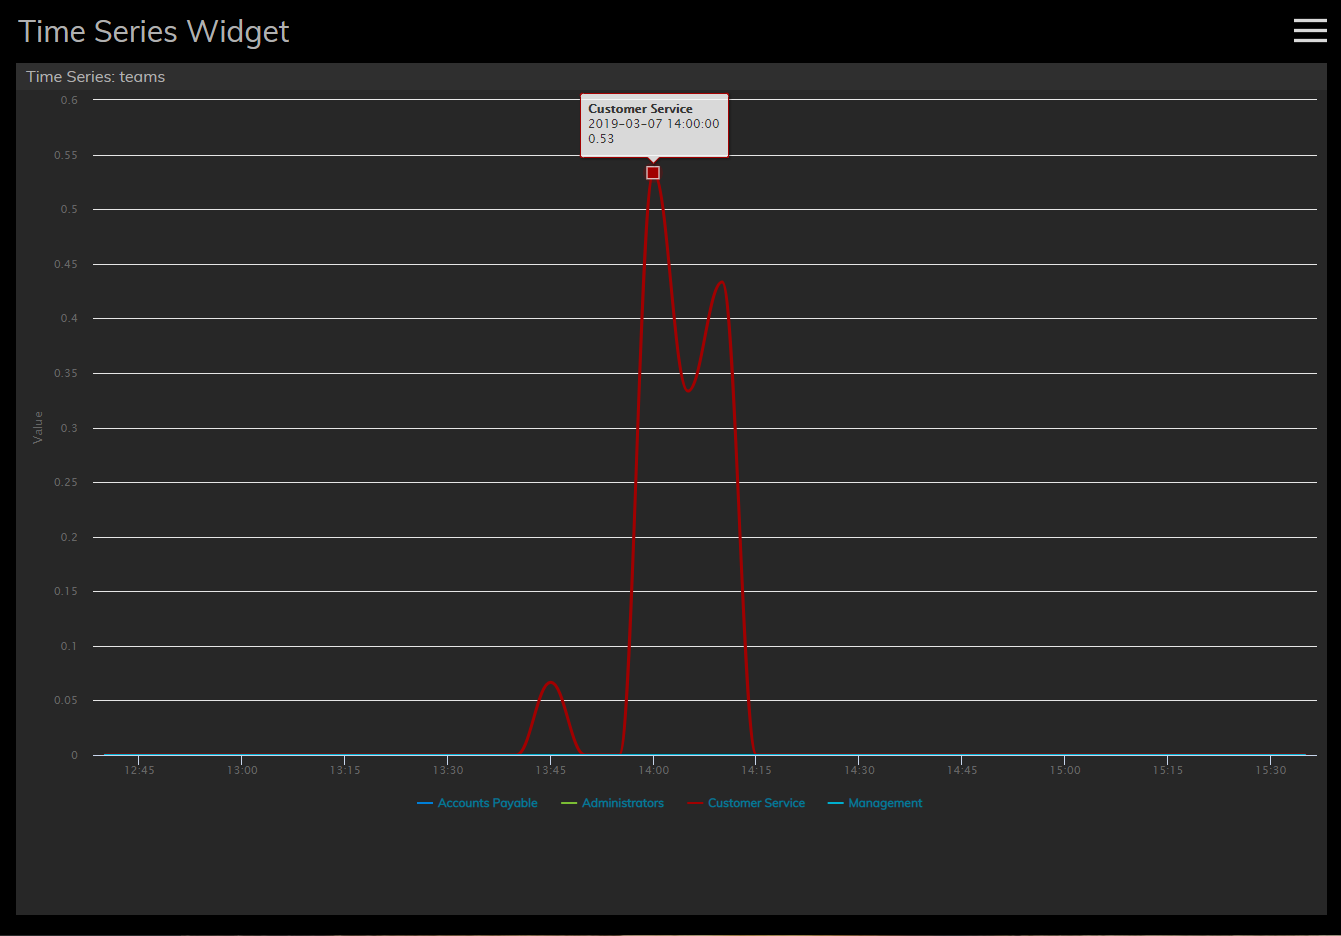
タイムシリーズウィジェットは、チームまたはサービス関連のメトリックのデータを表示し、それらを一定の時間間隔でグラフ化します。各統計データはチャートのY軸(つまり垂直)に表示され、選択された時間間隔はチャートのX軸(つまり水平)に表示されます。視覚的にわかりやすく表現されたデータ により、パフォーマンスを一目で監視し、短期または長期にわたって分析できます。
設定
ウォールボードのカスタマイズという権限を付与されたユーザーは、ウォールボードウィジェットのコントロール設定を編集できます。タイムシリーズの設定は以下の通りです。
タイトル
タイトルの設定により、ウィジェットに名前を付けることができます。
シリーズのタイプ
表示に使用できるシリーズタイプには、サービスとチームの2つのシリーズがあります。シリーズタイプは、Y軸に統計データとして表示されます。各統計データの値は、統計タイプごとに記録されます。シリーズタイプの統計データは次のとおりです。
Services Statistics
| Statistic | Value |
| Inbound in queue now | number of calls |
| Inbound in IVR, queue or on agents now | number of calls |
| Inbound interactions answered in Service Level % (moving window) | number of calls |
| Inbound in IVR now | number of calls |
| Inbound received | number of calls |
| Inbound abandoned | number of calls |
Teams Statistics
| Statistic | Value |
| Matching agents busy | number of agents |
| Matching agents logged-in | number of agents |
| Matching agents ready | number of agents |
| Matching agents not ready | number of agents |
| Occupancy of matching agents | percentage |
Time Range
For both Service and Team monitoring, the following time intervals are available for display on the X-axis of the chart:

