レポートの生成
左側のメニューから レポートというオプションを選択すると、アプリケーションペインに利用可能なレポートのリストが表示されます。初期設定上、これらはBright Pattern コンタクトセンターで提供される事前定義済みのレポートです。以前にJaspersoft Studioを使っていくつかのカスタムレポートを作成し、その定義をシステムにアップロードした場合、それらのカスタムレポートもリストに表示されます。利用可能なレポートおよびカスタムレポート定義の詳しい情報については、コンタクトセンター管理者ガイドのレポートテンプレートをご覧ください。

レポートは、それらが記述するコンタクトセンターリソースのタイプ別にグループ化されます。各グループ内では、レポートは対応するレポート定義の名前に従ってアルファベット順にリストされます。各レポートの説明が提供されます。説明が画面に収まらない場合は、その上にカーソルを合わせて、ツールチップボックスに説明の全文を表示します。
リストからご希望のタイプのレポートを選択します。表示されるビューで、レポート生成フィルターを使って、レポートを生成するリソースを選択し、レポート間隔を指定します。レポートのタイプに応じて、複数のリソースの選択、追加のフィルターの適用が可能です。

エージェント選択オプション
エージェントドロップダウンセレクターが存在するレポートの場合、以下にご注意ください:
- 次のレポートでは複数のエージェントを選択できます:
- エージェントアクティビティ
- エージェントアクティビティ (CSV)
- エージェントメール
- 絵ジェントログイン/ログアウト
- エージェントパフォーマンス
- 内部チャット
- チーム内サービス別
- チーム内エージェント別パフォーマンス
- エージェントの名前は、ドロップダウンセレクターにアルファベット順にリストされます。センターで設定されている表示名フォーマットによって、姓または名の順で表示されます。
- センターの設定された名前表示に応じて、名前の最初の文字を入力して特定のエージェントを検索できます。

- 30日間以上非アクティブであるエージェントは、ドロップダウンセレクターから除外されます。検索期間前の30日以内にアクティビティがあったエージェントの名前は、灰色・斜体フォントで表示されます。

- さらに、ドロップダウンメニューから無効/削除されたエージェントの表示 というチェックボックスを選択すると、レポートから無効化および/または削除されたエージェントを自動的に含めることができます。エージェントにはレポートの時間枠内にアクティビティがあった場合でも、上記は適用されます。
レポートのクローン
レポートをコピーするには、クローンボタンをクリックします。

クローンするレポートは、レポート名のクローンの下にある利用可能なレポートのリストにあります。ここで、レポートの 名前変更 および カスタマイズ が可能です。

クローンされたレポートの削除
クローンされたレポートを前レポートのリストから削除するには、削除ボタンをクリックします。削除できるのは、クローンされたレポートのみです。選択したレポートは、コンタクトセンターで利用可能な全レポートリストから削除されます。

レポートの名前変更
レポートの名前変更を行うには、 名前変更ボタンをクリックします。レポートの新しい名前を入力するためのダイアログウィンドウが表示されます。選択したレポートに新しい名前が表示され、コンタクトセンターで利用可能な全レポートリストから利用できるようになります。

レポートの生成
レポートを生成するには、レポート詳細ペインの下部にある レポートの生成ボタンをクリックします。レポートの生成には少し時間がかかる場合があります。

レポートは別のブラウザータブ/ウィンドウに表示され、使用可能なブラウザーウィンドウスペース全体を占めるように拡大されます。したがって、ブラウザで複数のレポートを同時に開くことができます。生成されたレポートは、コンタクトセンター管理者アプリケーションを閉じた場合でも引き続き表示できます。データ量によっては、生成されたレポートが数ページで表示する場合があります。

How to View and Use the Generated Report
The generated report appears as a static table of data within your browser tab/window. Usable links for navigation and export are located at the top of the page. If you export the report to a format such as .XLS, you can filter, sort, and reformat the data just as you would for any other spreadsheet.
To navigate through the contents of the report, use the page navigation arrows or enter the page number you wish to view.
Metrics
To learn more about the metrics provided by each report, see sections Detail Reports and Aggregate Reports.
Exporting Reports
To export the generated report, choose the format (PDF, XLS, CSV, or TXT), and click the corresponding link.
Running the Report Again
To run the same report for a different resource and/or different reporting interval, simply change the filter setting and click the Run Report button again.
Going Back to Reports
To return to the list of reports, go back to the Contact Center Administrator application, section Reports, in your other browser tab or window.
How to Customize Reports
To customize the presentation of the report, click the Customize button.

The report will be opened in a new browser tab or window in the Report Customizer application.

This web application allows you to do the following:
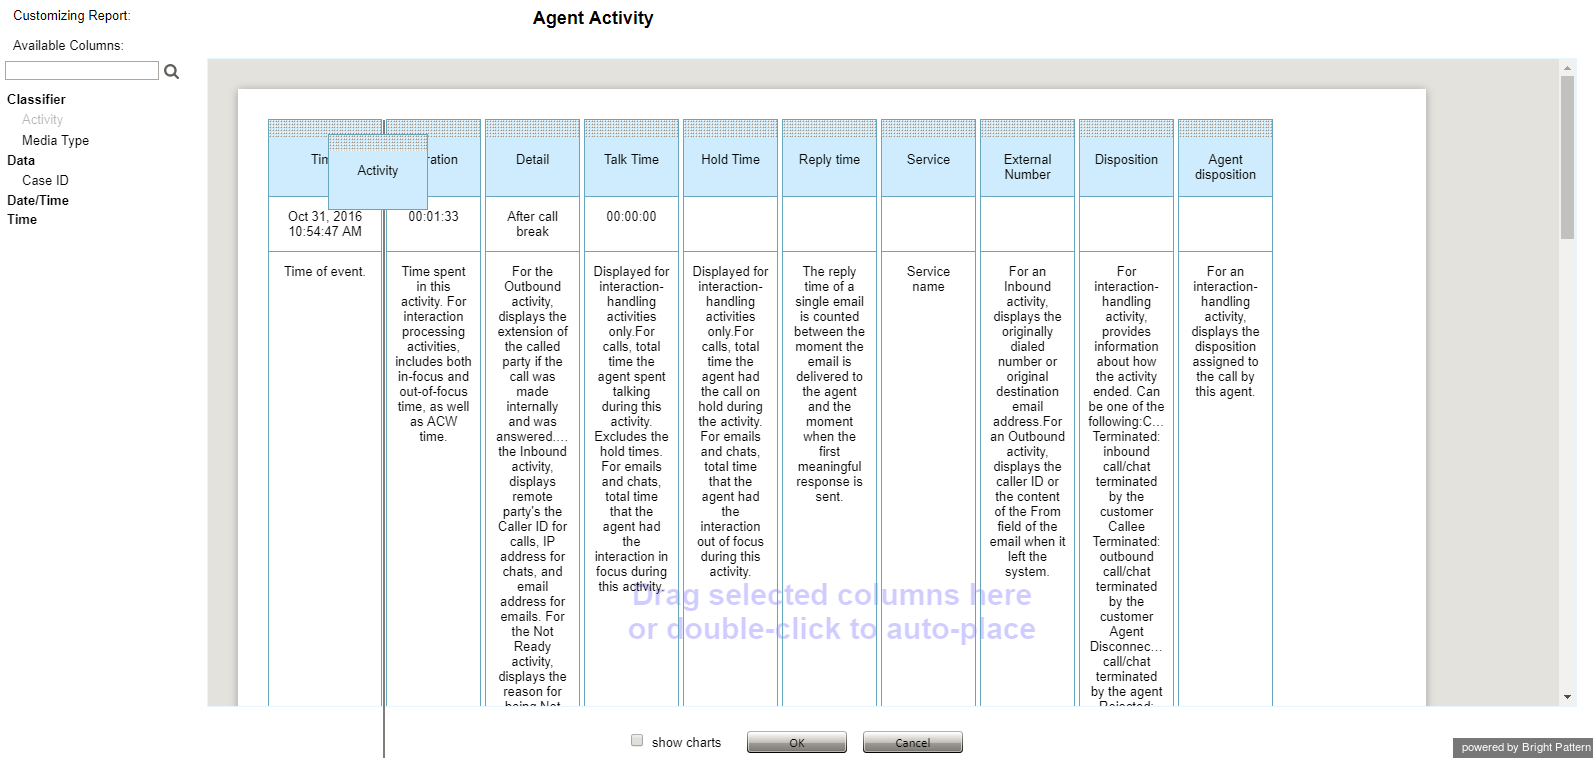
- Click and drag columns onto different places on the report
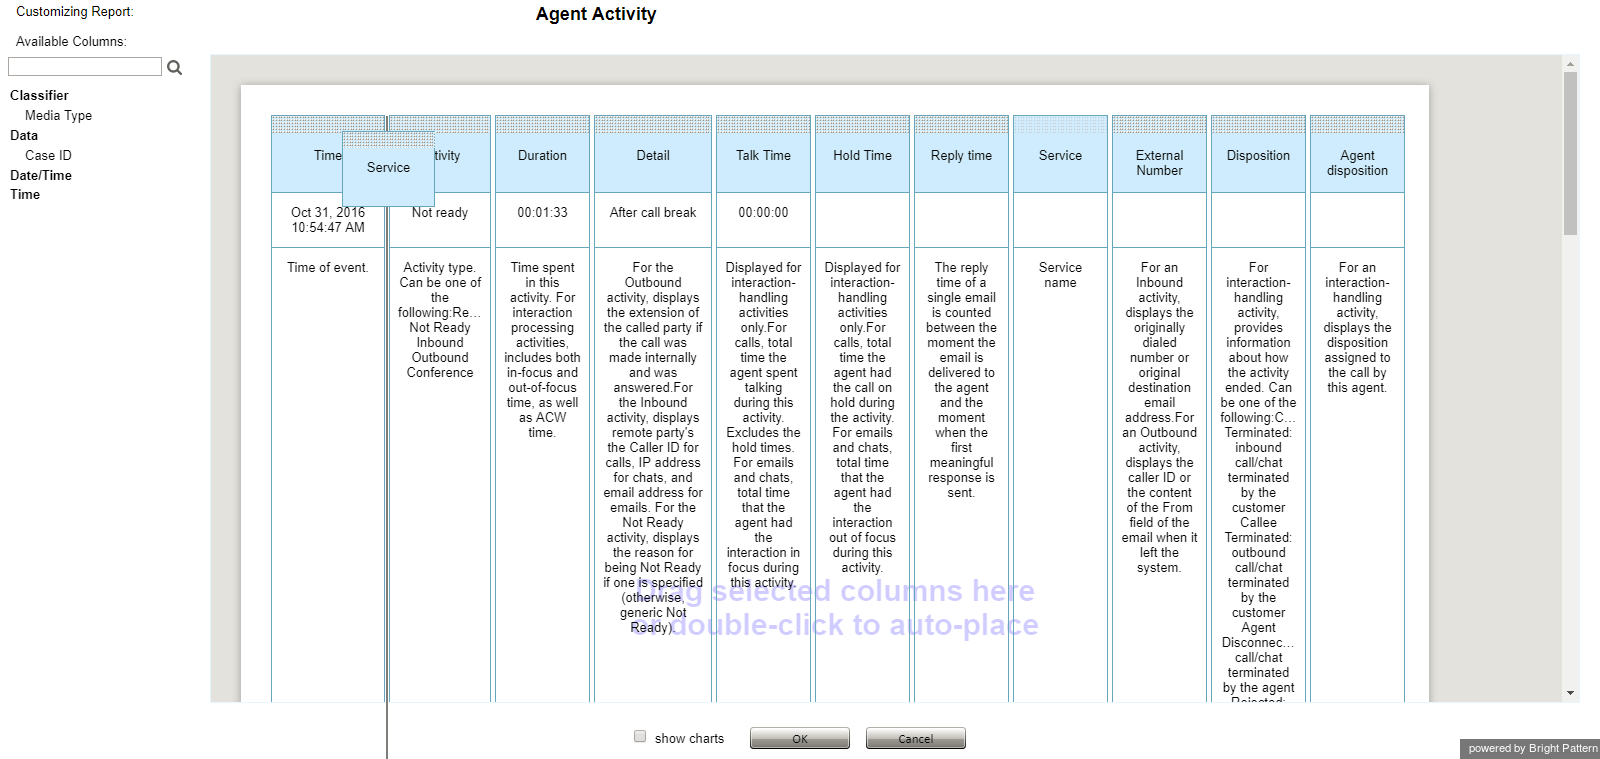
- Adjust the width of columns by clicking and dragging the column borders
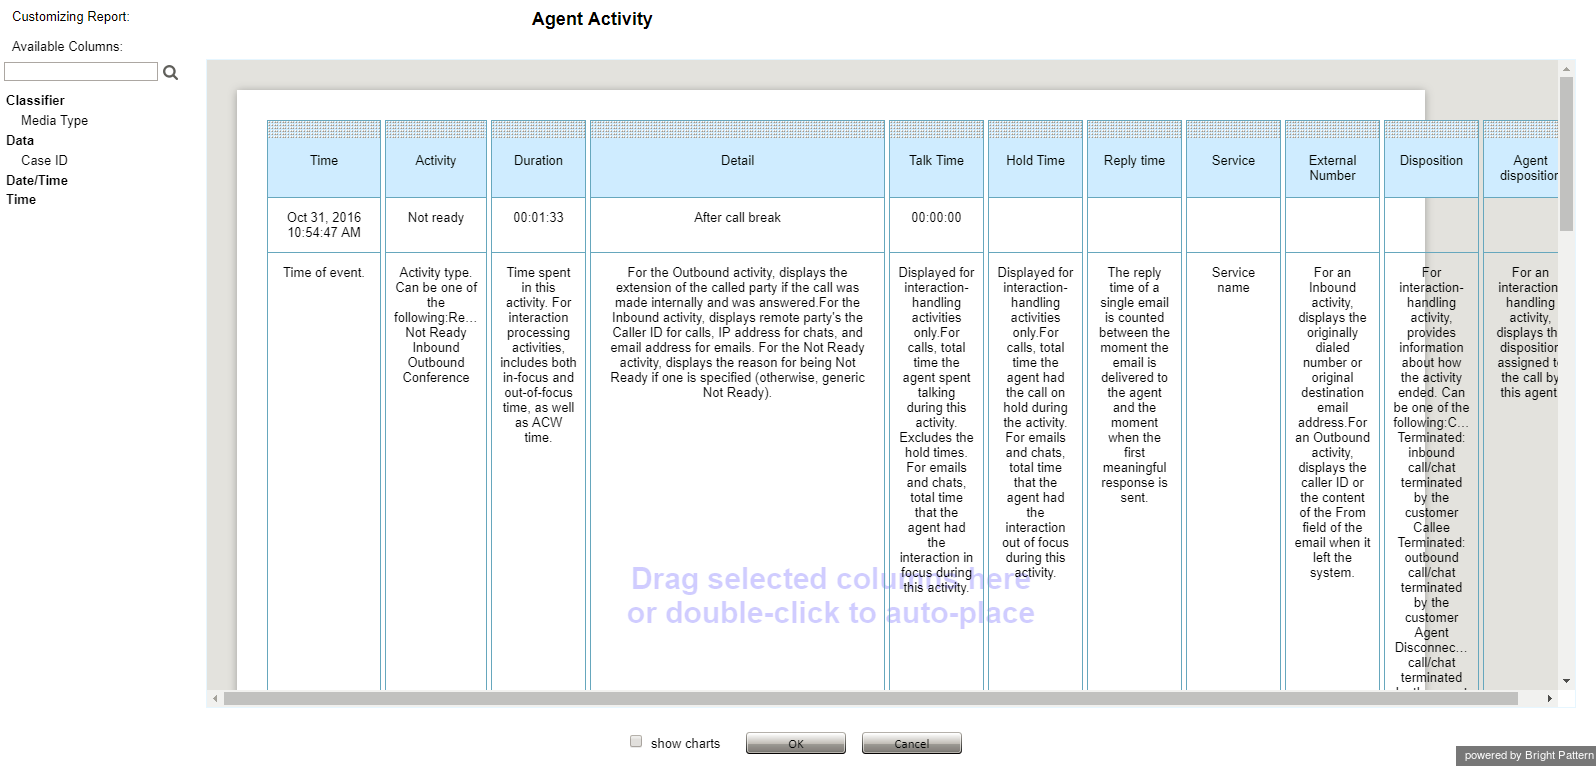
- Remove columns by dragging them to the margin of the report
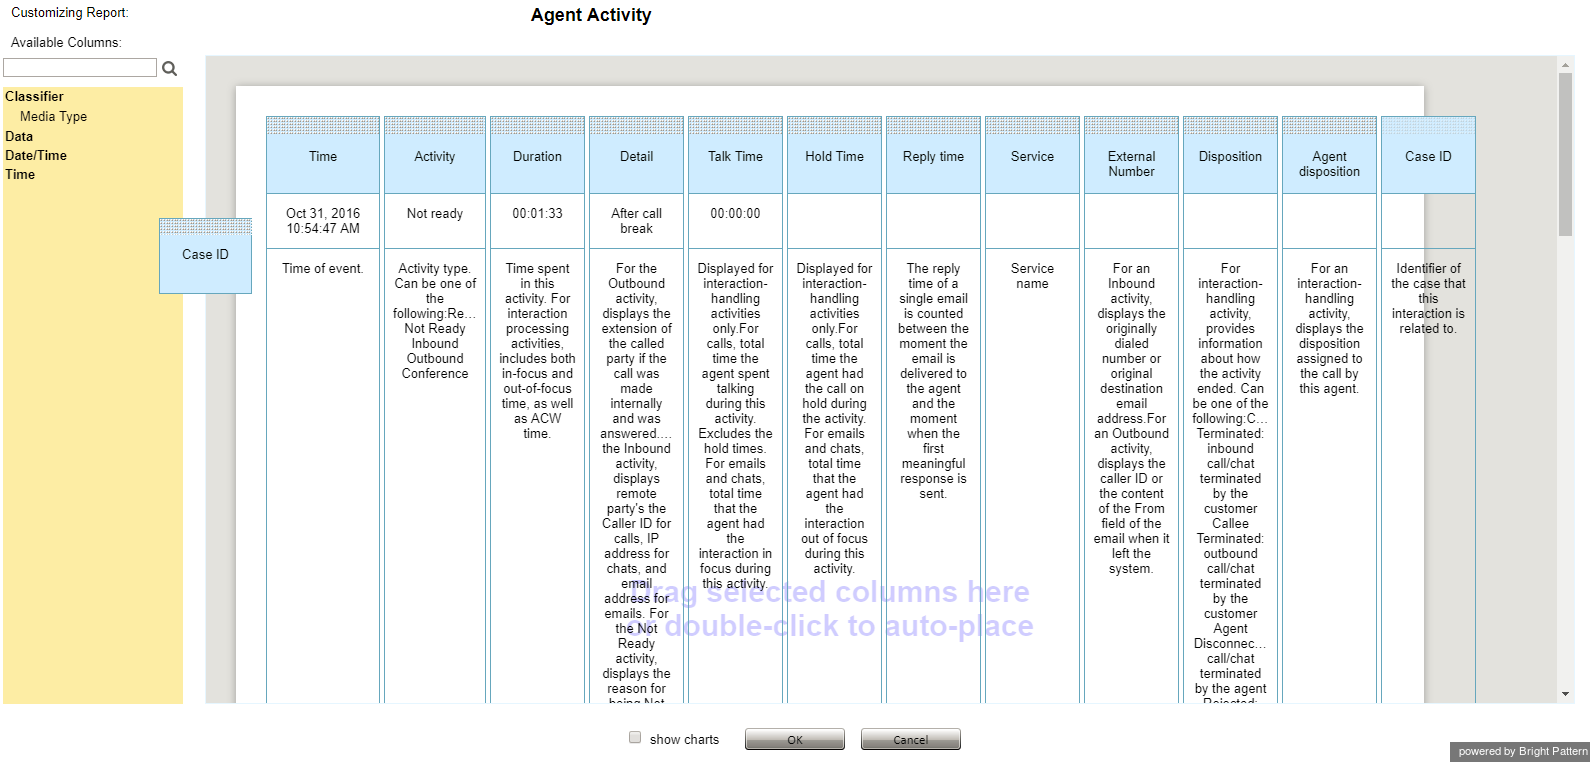
- Add columns by dragging them from the margin of the report to the main screen of the report
- Rename columns by clicking into the column title
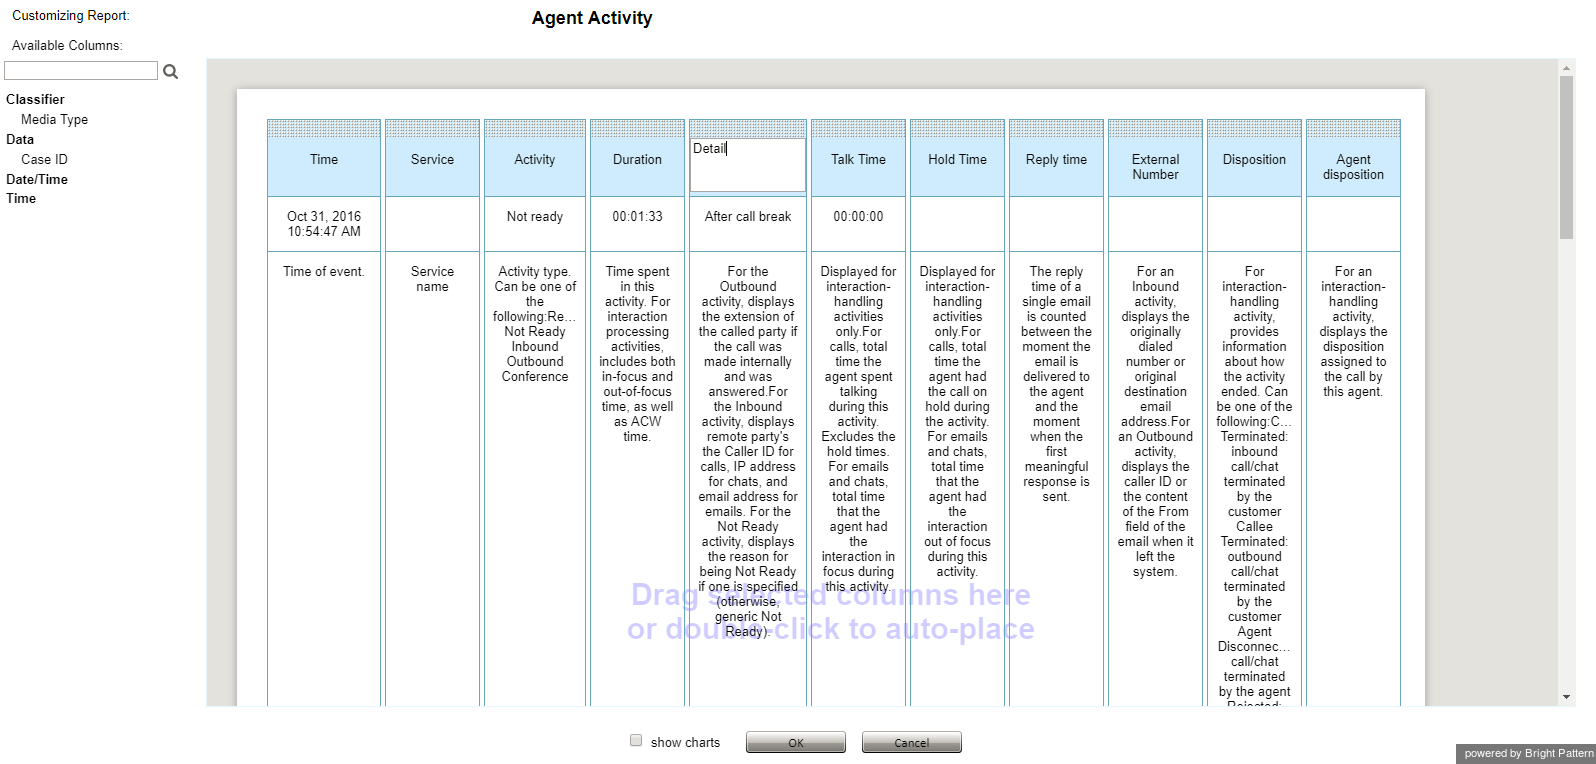
- Search the report columns for specific keywords
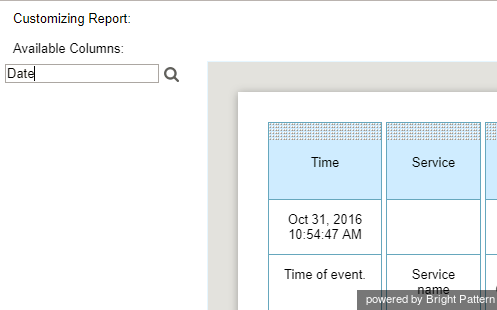
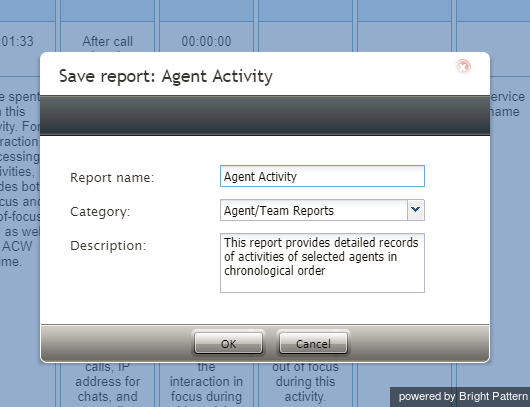
- Save your customized report with a new name and description


Other Actions
- To view available charts for the report, select the show charts checkbox.
- To save your customized report, click OK.
- To cancel customization and exit the Report Customizer, click Cancel.
Scheduling Reports
You can also schedule automatic generation of reports and their delivery to specified destinations as email attachments or via FTP. For more information, see Scheduling Reports.