(Marked this version for translation) |
|||
| Line 1: | Line 1: | ||
| − | <translate>= About Time Series Widgets = | + | <translate>= About Time Series Widgets = <!--T:1--> |
''Time series'' widgets display data from team or service related metrics and charts them over regular time intervals. This visualized data allows you to monitor performance at a glance and analyze it over short or long periods of time. When regular performance levels are known, time series graphs also help you to recognize if something abnormal is happening in your contact center. | ''Time series'' widgets display data from team or service related metrics and charts them over regular time intervals. This visualized data allows you to monitor performance at a glance and analyze it over short or long periods of time. When regular performance levels are known, time series graphs also help you to recognize if something abnormal is happening in your contact center. | ||
| + | <!--T:2--> | ||
Note that Time Series widgets are enabled by service providers; for more information, contact your provider. | Note that Time Series widgets are enabled by service providers; for more information, contact your provider. | ||
| − | == Widget Selection == | + | == Widget Selection == <!--T:3--> |
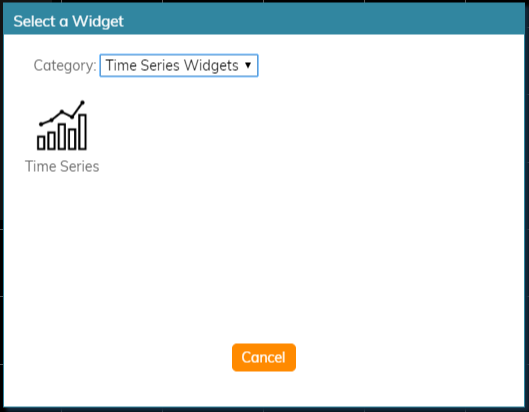
To add time series widgets to your wallboard, you must be in ''Edit'' mode. Click inside an empty [[wallboard-builder-reference-guide/EditMode#Cards|cards]] or draw a card on an empty wallboard spot; both actions will bring up the widget selector. Click on the widget type you want, configure its settings, and it will populate the card. | To add time series widgets to your wallboard, you must be in ''Edit'' mode. Click inside an empty [[wallboard-builder-reference-guide/EditMode#Cards|cards]] or draw a card on an empty wallboard spot; both actions will bring up the widget selector. Click on the widget type you want, configure its settings, and it will populate the card. | ||
| + | <!--T:4--> | ||
For more information, see [[Wallboard-builder-reference-guide/TimeSeriesConfiguration|Time Series Widgets]]. | For more information, see [[Wallboard-builder-reference-guide/TimeSeriesConfiguration|Time Series Widgets]]. | ||
| + | <!--T:5--> | ||
[[File:Time-Series-Widgets-Selection-53.PNG|650px|thumb|center|Time series widget selector]] | [[File:Time-Series-Widgets-Selection-53.PNG|650px|thumb|center|Time series widget selector]] | ||
Revision as of 22:51, 20 November 2019
<translate>= About Time Series Widgets = Time series widgets display data from team or service related metrics and charts them over regular time intervals. This visualized data allows you to monitor performance at a glance and analyze it over short or long periods of time. When regular performance levels are known, time series graphs also help you to recognize if something abnormal is happening in your contact center.
Note that Time Series widgets are enabled by service providers; for more information, contact your provider.
Widget Selection
To add time series widgets to your wallboard, you must be in Edit mode. Click inside an empty cards or draw a card on an empty wallboard spot; both actions will bring up the widget selector. Click on the widget type you want, configure its settings, and it will populate the card.
For more information, see Time Series Widgets.
</translate>

