Gauge
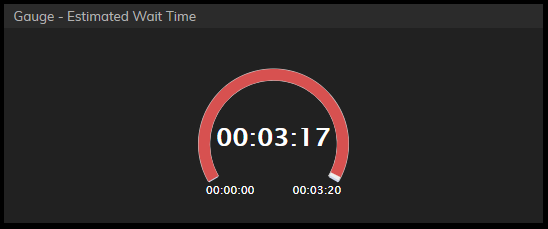
Gauge is a display type for a single statistic widget. On a Gauge widget, information is presented in a meter-like (i.e., gauge-like display) for one statistic or metric only. You may add a standalone Gauge widget to your wallboard, or you may enable gauge display for any other type of primary single statistic on your wallboard.

Settings

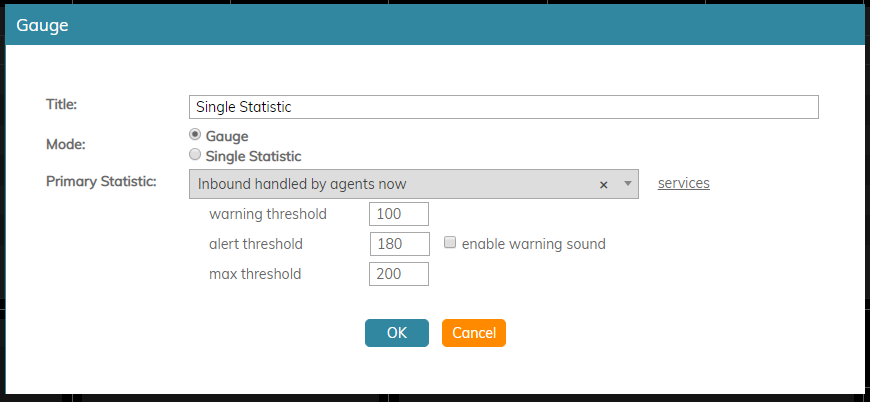
Users with the privilege Customize Wallboards may edit the control settings of wallboard widgets. Gauge settings are as follows.
Title
Title is the name of the statistic widget. Widget titles, along with their icons, are displayed in the widget selector.
Mode
The default mode for gauge is Gauge; however, it is possible to change the mode to Single Statistic.
Primary Statistic
The Primary Statistic is the main single statistic to be shown in the widget.
The drop-down menu provides the following single statistics from which to choose:
- Agents busy with this service
- Agents in ACW state
- Average idle time of matching agents
- Average preview time of matching agents
- Average speed of answer/reply
- Callbacks in queue now
- Callbacks requested
- Completed records in active lists
- Completed records with personal agent assignments
- Count of records in all active lists
- Count of selected dispositions
- Custom Survey Metric 1
- Custom Survey Metric 2
- Customer Satisfaction
- Estimated campaign duration
- Estimated wait time
- First Call Resolution
- Inbound abandoned
- Inbound abandoned %
- Inbound abandoned in IVR
- Inbound abandoned in queue
- Inbound abandoned in queue %
- Inbound abandoned while ringing
- Inbound dropped by system in IVR
- Inbound dropped by system in queue
- Inbound dropped by system while ringing
- Inbound duration average
- Inbound duration total
- Inbound emails carried over
- Inbound emails dispositioned without reply
- Inbound emails for existing queued cases
- Inbound emails handled
- Inbound emails in personal queues now
- Inbound emails not accepted
- Inbound emails that created new cases
- Inbound handled by agents
- Inbound handled by agents %
- Inbound handled by agents now
- Inbound in IVR now
- Inbound in IVR, queue or on agents now
- Inbound interactions answered in Service Level % (moving window)
- Inbound longest wait now
- Inbound queued
- Inbound received as transfers
- Inbound rejected or missed by agents
- Inbound released by agents
- Inbound released by callers
- Inbound routed to agents
- Inbound self serviced
- Inbound Service Level target
- Inbound Service Level threshold
- Inbound short-abandoned in queue
- Inbound short-abandoned in queue %
- Inbound transferred away
- IN Svc Level Day %
- Matching agents busy
- Matching agents logged-in
- Matching agents not ready
- Matching agents ready
- Net Promoter Score
- Number of interactions recategorized from a different service
- Number of interactions recategorized to a different service
- Number of nonreplies started and discarded by agents
- Number of records excluded by DNC lists from active Lists
- Occupancy of matching agents
- Outbound call attempts
- Outbound call attempts in progress now
- Outbound calling rate now
- Outbound calls abandoned
- Outbound calls abandoned %
- Outbound calls abandoned in IVR
- Outbound calls abandoned in IVR %
- Outbound calls abandoned in queue
- Outbound calls abandoned in queue %
- Outbound calls abandoned while ringing
- Outbound calls answered, out of connection speed compliance
- Outbound calls answered, out of connection speed compliance %
- Outbound calls attempts successful
- Outbound calls attempts successful %
- Outbound calls attempts failed
- Outbound calls dropped in IVR
- Outbound calls dropped in queue
- Outbound calls dropped while ringing
- Outbound calls duration average
- Outbound calls duration total
- Outbound calls in IVR %
- Outbound calls in queue now
- Outbound calls queue
- Outbound calls rejected or missed by agents
- Outbound calls released by agent
- Outbound calls released by remote party
- Outbound calls ringing on agents now
- Outbound calls routed to agents
- Outbound calls self serviced
- Outbound calls transferred away
- Outbound interactions handled by agents (email - send non-replies)
- Outbound interactions handled by agents now
- Records attempts
- Records attempts %
- Records completed in active lists %
- Records completions
- Records completions %
- Records in quota groups that reached quota limits
- Records previews
- Records skips
- Records skips %
- Remaining records in active lists
- Remaining records with personal agent assignments
- Selected Dispositions Percentage
services
Clicking the services link allows you to select and add the available services that are associated with the single statistic.
enable warning sound
Selecting the enable warning sound checkbox enables the Agent Desktop to play a warning sound whenever service level thresholds are exceeded for the given statistic or metric.
enable gauge display
Selecting the enable gauge display checkbox will cause the widget to change its appearance when certain thresholds are exceeded (see below).
When gauge display is enabled, the following values may be defined:
- warning threshold - Causes the gauge to change color when exceeded
- alert threshold - Plays a warning sound when exceeded
- max threshold - The most that can be displayed
Note: Deselecting the enable gauge display checkbox will cause the Secondary Statistic field to appear, allowing you to add a second statistic to the widget.