Home Page
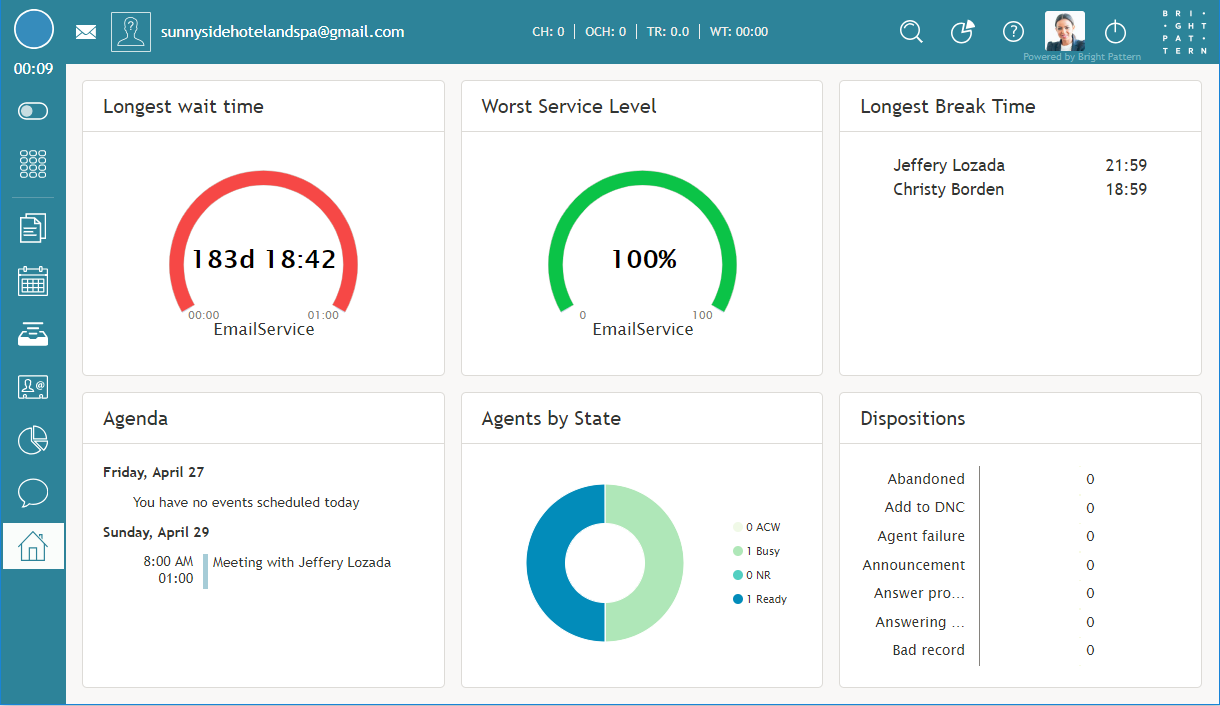
The home page displays widgets containing metrics that allow you to monitor key areas of your and your team's performance. You can change the placement of the widgets and configure some widget metrics. As a supervisor, your view of the home page is different than your agents' view as you have more widget options.
Home Page Widgets
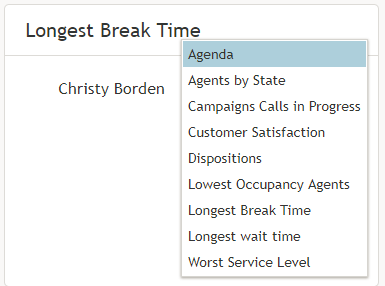
There are nine widget options in total: six standard plus three additional widgets available to supervisors. There are six slots for these widgets to be displayed in. The following are the widgets available for display:
- Agenda
- Agent by State
- Campaigns Calls in Progress
- Customer Satisfaction
- Dispositions
- Lowest Occupancy Agents
- Longest Break Time
- Longest Wait Time
- Worst Service Level
To change the display in a given widget, click the down arrow ![]() located in the upper right-hand corner of the widget. This will produce a drop-down menu that allows you to choose any of the widgets for display.
located in the upper right-hand corner of the widget. This will produce a drop-down menu that allows you to choose any of the widgets for display.
Widget Descriptions
The following is a list of the widgets available for the home page, including descriptions of what they do and the metrics they contain. Widgets are listed in alphabetical order.
Agenda
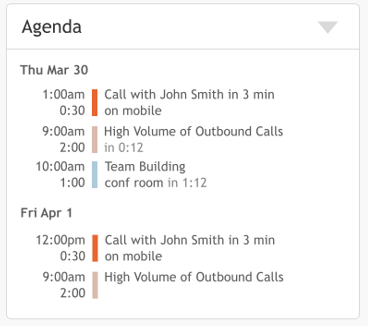
The Agenda widget displays upcoming agenda items from your Calendar. If there is no agenda, the widget will display text stating so.
The widget shows your schedule for today based on the current time (all items currently in progress and scheduled later than the current time). Items in progress or items that are due in less than 10 minutes are shown with a red bar on the left side. Items that are due in less than two hours are shown with a brown bar on the left side. Other items are shown with a blue bar on the left side.
If the number of scheduled items is too large, then widget shows the top few items and dots (“…”). If you click within the widget, Agent Desktop navigates to the Calendar.
Agent by State
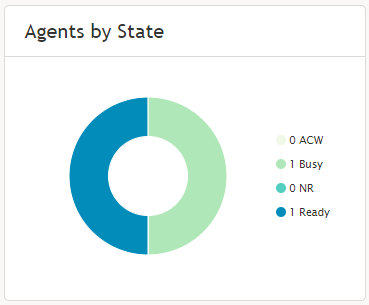
The Agent by State pie chart shows the state of all logged-in agents from your sub-teams. The following states displayed are:
It is possible to filter each of these states out of view by clicking on the state name. To filter a state back in, click on the name again.
Campaigns Calls in Progress
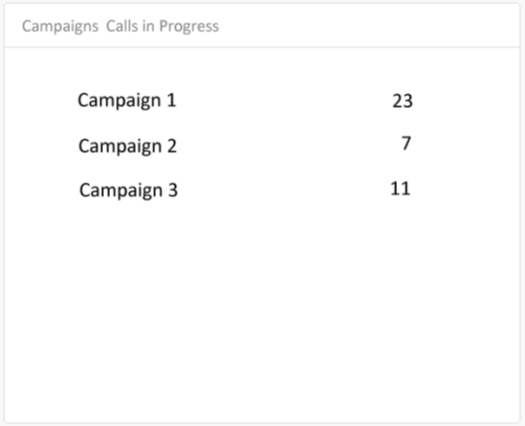
Campaign Calls in Progress displays the number of calls currently being attempted in all running outbound campaigns.
Customer Satisfaction
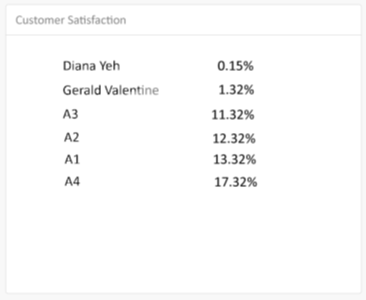
The Customer Satisfaction widget displays the results of customer satisfaction surveys per agent; the results are displayed as a percentage (0-100).
Dispositions
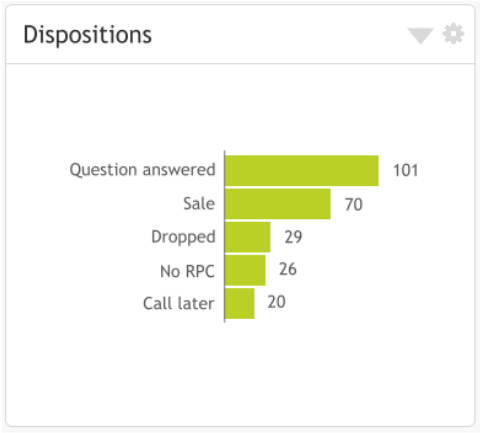
Dispositions displays the count of selected dispositions for all agents on the team, summed by dispositions; these are configured by your contact center administrator.
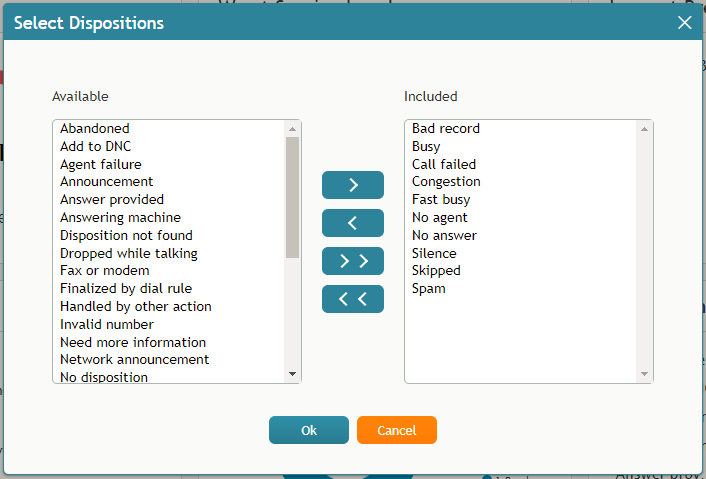
To add or remove dispositions from the widget, click the cog icon ![]() in the upper right-hand corner of the metric. From here, you may select from the pop-out menu which dispositions will be displayed.
in the upper right-hand corner of the metric. From here, you may select from the pop-out menu which dispositions will be displayed.
Lowest Occupancy Agents
Lowest Occupancy Agents displays the top 7 agents with the lowest occupancy rates. Occupancy is the average percentage of time agents that have spent handling interactions of the given service (including the preview time and after-call work) relative to their total working time (i.e., the time the agents have spent handling interactions of any service and being Ready to handle interactions).
Longest Break Time
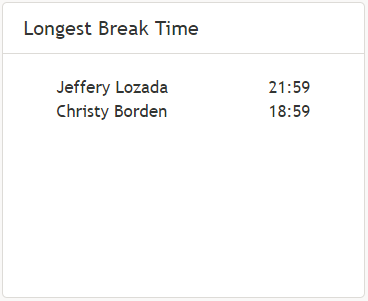
Longest Break Time displays the names of the top 7 agents with the longest Break time; this metric also includes the time spent in the Not Ready, Lunch, and Away From Desk states.
Longest Wait Time
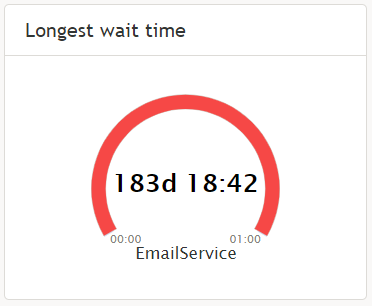
Longest Wait Time shows the longest wait time for a given service; the name of the service will be displayed at the bottom. Default thresholds (in minutes) are 10, 20, 40 and are displayed as the corresponding colors green, yellow, and red.
Worst Service Level
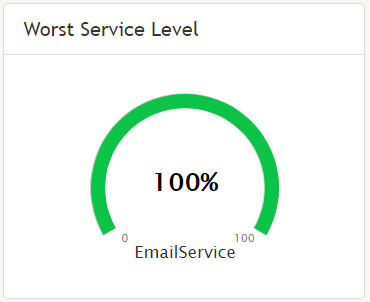
The Worst Service Level widget, utilizing the metric IN Svc Level %, specifically highlights the service with the lowest percentage of handled interactions. Default threshold percentages are 50, 75, 90, and are displayed as the corresponding colors red, yellow, green.

